
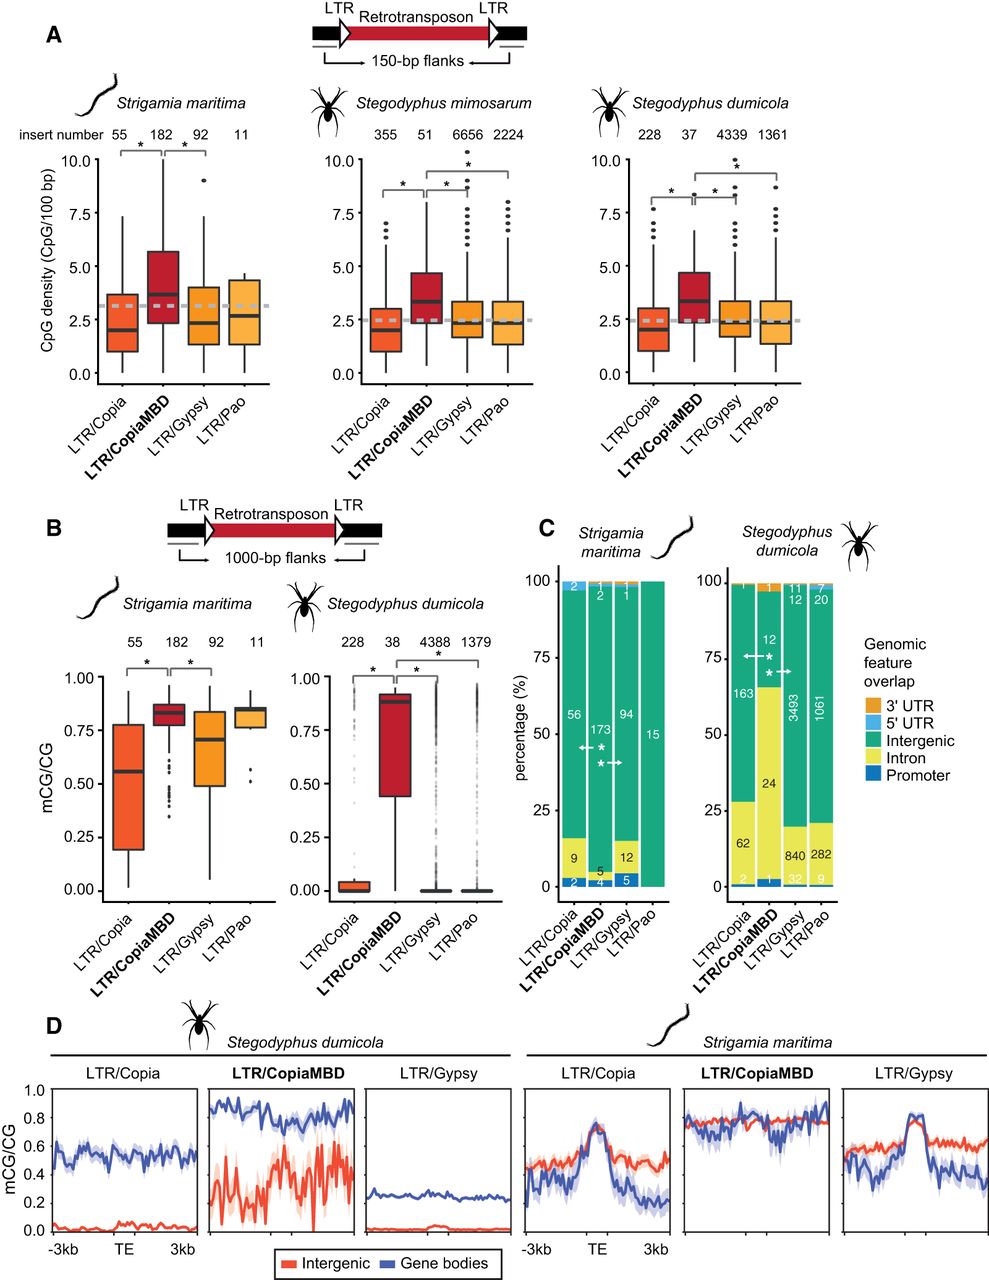
LTR-retrotransposon insertion distribution in the Stegodyphus and Strigamia genomes. (A) Distribution of CpG densities in the 150-bp flanking regions surrounding LTR-retrotransposons classified in four major classes. Asterisks represent Wilcoxon one-sided rank-sum test P < 0.01; the dashed gray line shows the genomic CpG density for each species. (B) Distribution of methylation levels in the 1000-bp flanking regions surrounding LTR-retrotransposons. (C) LTR-retrotransposon insertion intersections with genomic features based on an RNA-seq annotation (StringTie). Asterisks represent Fisher's exact two-sided test P < 0.01 comparing intergenic versus nonintergenic overlap proportions between LTR/CopiaMBD and LTR/Copia and LTR/Gypsy, respectively. (D) Average methylation levels on LTR-retrotransposon insertions divided by location within intergenic regions or gene bodies (nonintergenic categories in panel C). Thick line depicts mean methylation; shade, SE.


