
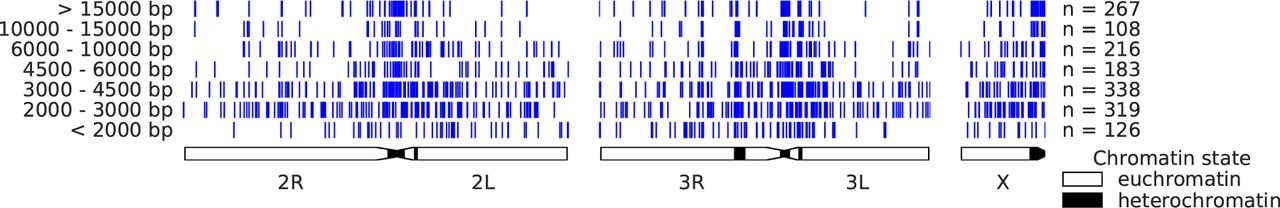
Figure 1.
Distribution of CNVs in different size ranges across the genome. Blue bars represent regions of the genome in which a CNV was found. Numbers on the left indicate the CNV size range. Numbers on the right show the number of CNVs in that size range. Simulations showed a significant enrichment of CNVs in heterochromatic regions (0 out of 10,000 simulations had as many CNVs in the heterochromatin).


