
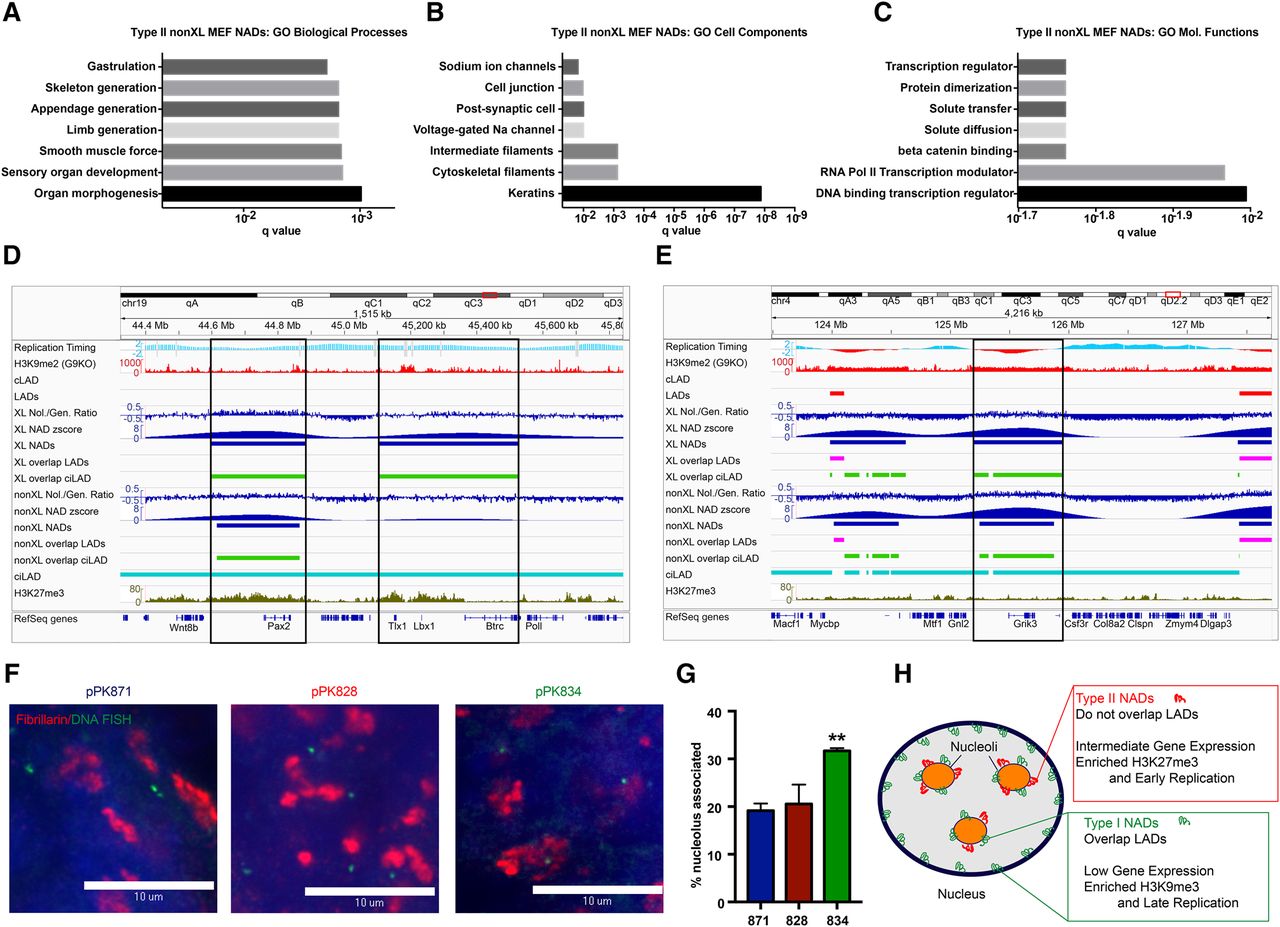
Type II NADs contain developmentally regulated genes and can be differentially localized in MEF and ES cells. (A) GO enrichment analysis of Type II NADs (nonXL). In this panel, the seven most significant Biological Processes annotations and Q-values are shown. (B) As in A, showing the Cell Components annotations. (C) As in A, showing the Molecular Functions annotations. (D) Analysis of specific loci, using the same Integrative Genomics Viewer (IGV) (Thorvaldsdóttir et al. 2013) session as in Figure 2, except that tracks showing NADfinder-derived Z-scores are also included. Genomic region showing two Type II NAD peaks (the one on the right achieved a statistical significance of Q < 10 × 10−3 only in the XL but not nonXL data). The peak on the left contains the Pax2 transcription factor gene. The peak on the right contains the Tlx1 and Lbx1 homeobox transcription factor genes. (E) As in D, showing a Type II peak containing the Grik3 glutamate receptor gene. (F) Single optical sections of confocal microscopy images of 3D FISH analysis of mouse D3 ES cells. BAC DNA probes are labeled in green, fibrillarin in red, and the scale bar is 10 μm. In MEFs, pPK871 is a negative control probe, pPK828 is a Type II NAD, and pPK834 is a Type I NAD (see Fig. 3). (G) Quantification of D3 mES cell DNA-FISH. Graph (left), percentage of alleles from the indicated probes associated with nucleoli (mean ± SEM). Welch's t-tests for difference from pPK871: (**) pPK834 (P = 0.0018); pPK828 (P = 0.62). (H) A diagram that summarizes the distinct characteristics of Type I and II NADs.


