
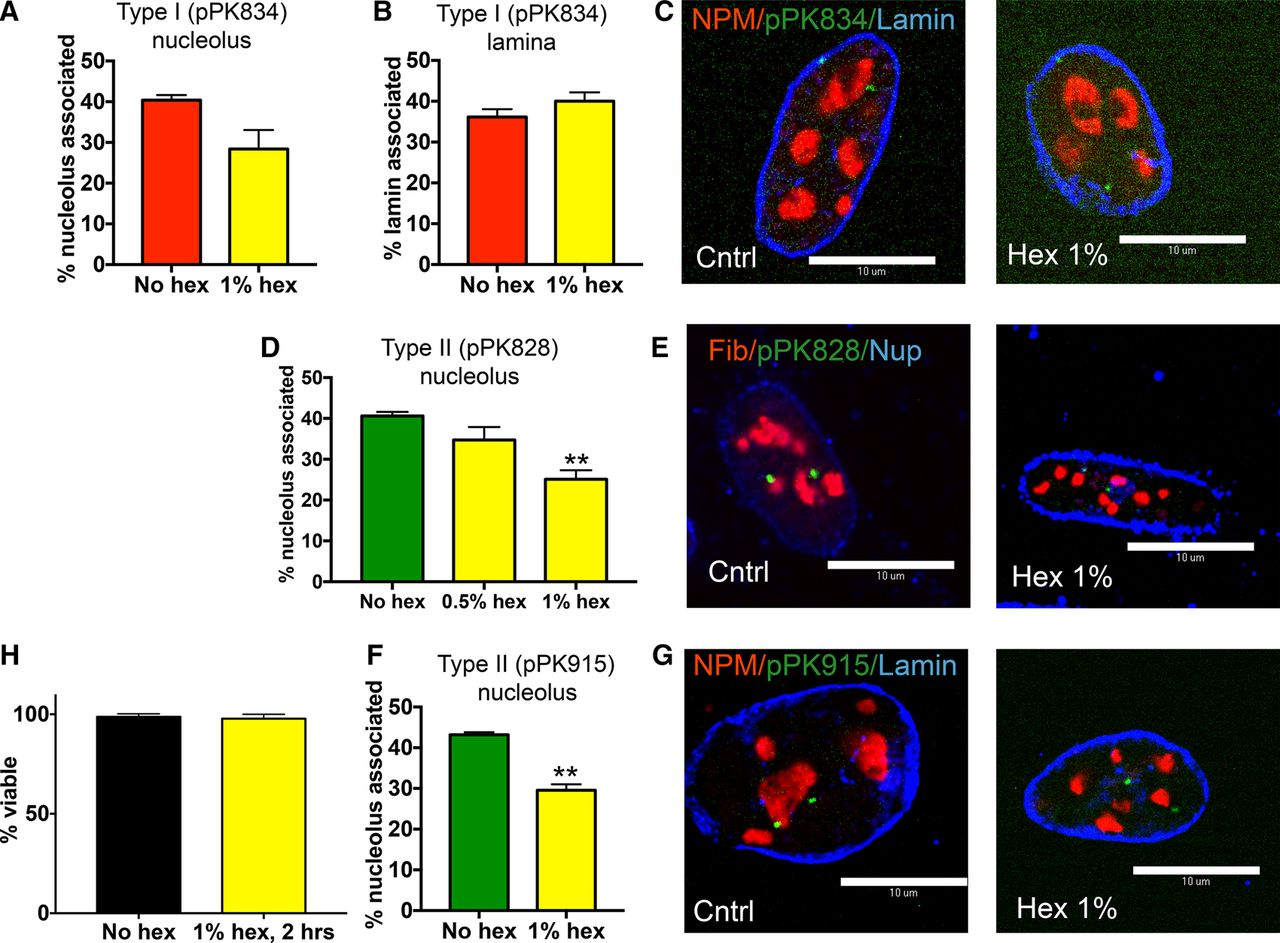
Response of NADs to hexanediol treatment. (A) Quantitation of Type I NAD probe pPK834 nucleolar associations in control and hexanediol-treated cells measured by 3D-DNA-FISH as in Figure 3. The changes observed did not achieve statistical significance (P = 0.11, Welch's t-test). (B) As in A, laminar associations were measured. The changes observed were not statistically significant (P = 0.24, Welch's t-test). (C) Representative 3D immuno-FISH localization of Type I NAD probe pPK834 (green), anti-nucleophosmin antibodies (NPM, red), and Anti-Lamin A antibodies (blue): (left) untreated control cells; (right) hexanediol-treated cells. (D) Quantitation of Type II NAD probe pPK828 nucleolar associations: (**) P = 0.0090, Welch's t-test. (E) Representative 3D immuno-FISH localization of Type II NAD probe pPK828 (green), anti-fibrillarin antibodies (Fib, red), and anti-NUP62 antibodies (blue): (left) untreated control cells; (right) hexanediol-treated cells. (F) Quantitation of Type II NAD probe pPK915 nucleolar associations: (**) P = 0.0051, Welch's t-test. (G) Representative 3D immuno-FISH localization of Type II probe pPK915 (green), anti-nucleophosmin antibodies (NPM, red), and Anti-Lamin A antibodies (blue): (left) untreated control cells; (right) hexanediol-treated cells. (H) Cells were either untreated or treated with 1% hexanediol for 2 h and stained with trypan blue to measure viability.


