
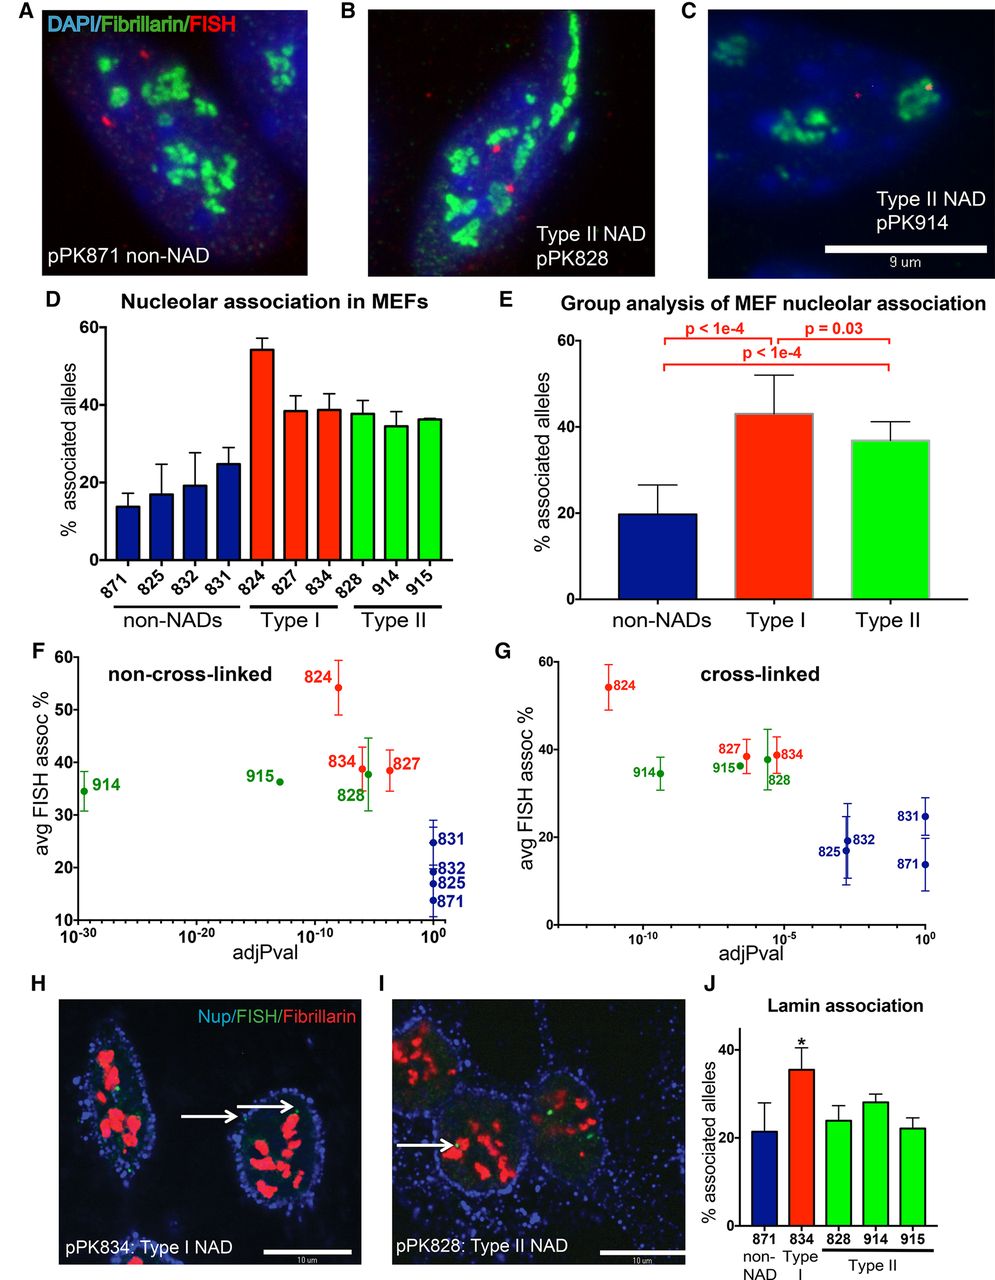
Three-dimensional (3D) DNA-FISH experiments confirm nucleolar association of NADs. (A) Maximum projection of confocal microscopy images from a 3D immuno-FISH experiment: (red) pPK871 BAC DNA probe; (green) fibrillarin; (blue) DAPI; (scale bar) 10 μm. (B) As in A, with pPK828 as the DNA probe. (C) As in A, with pPK914 as the DNA probe. (D) Graph of percentage of alleles that are associated with nucleolus (mean ± SEM for n ≥ 3 biological replicate experiments). Negative probes (blue) display nucleolar association that is not significantly different than the negative probe pPK871 (P > 0.05, Welch's t-test). In contrast, all Type I (red) and Type II (green) probes display association significantly different from pPK871 (P < 0.03). (E) Data for nucleolar association from D were grouped (see coloration). P-values for the differences between the different groups are shown. (F) Graph comparing the percentage of nucleolar-associated alleles from DNA-FISH (y-axis) versus the adjusted P-value (x-axis) of the nonXL NAD peaks identified by NADfinder that overlap with the indicated BAC probe. Note that the “negative” probes (blue) have an adjusted P-value = 1 = 10 × 100. (G) As in F except that the x-axis is the adjusted P-value of the XL NAD peaks. Note that the “negative” probes (blue) have an adjusted P-value > 10 × 10−3. (H) Single optical sections of confocal microscopy images of a 3D immuno-FISH experiment. pPK834 BAC DNA probe hybridizing to a Type I NAD (green); (red) fibrillarin; (blue) nuclear pore protein NUP62; (scale bar) 10 μm. (I) As in H, with pPK828 hybridizing to a Type II NAD. (J) Graph of percentage of alleles that are associated with nuclear periphery (mean ± SEM for n ≥ 3 biological replicate experiments). Only Type I NAD probe pPK834 (*) displays laminar association that is significantly different than the negative control pPK871 (P = 0.042, Welch's t-test). As expected, three Type II NAD probes (pPK828, 914, and 915) do not display significant laminar association.


