
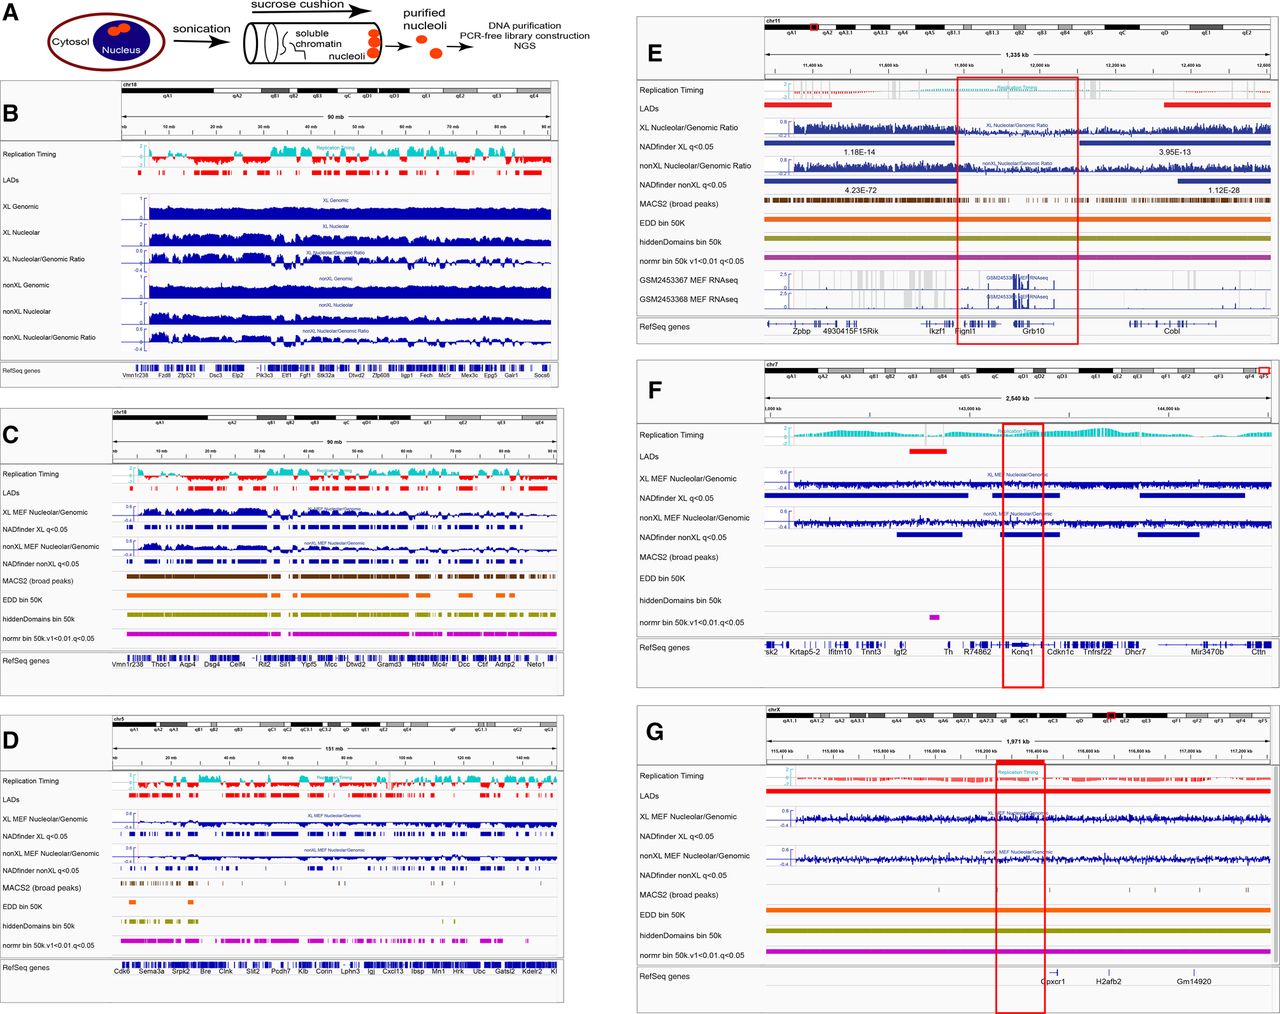
Identification of mouse nucleolus-associated domains (NADs). (A) A schematic workflow of nucleolar isolation. Details that differ between the cross-linked and non-cross-linked versions of the preparation are illustrated in Supplemental Figure S1. (B) Analysis of raw NAD sequencing data and comparison to heterochromatin features. All data shown are from MEF cells. The strongly nucleolar-associated Chromosome 18 is shown in its entirety. From the top, tracks shown are DNA replication timing (RT) data (Hiratani et al. 2010) (early replicating regions have positive values in cyan; late replicating regions have negative values in red) and LADs (red) (Peric-Hupkes et al. 2010). Below those are raw sequence data from cross-linked cells (blue, experiment #26): read counts for total genomic DNA (genomic), nucleolar-associated DNA (nucleolar), and the nucleolar/genomic ratio, followed by the analogous data from non-cross-linked (nonXL) experiment #29. (C) Analysis of NAD-seq by multiple bioinformatic packages, including NADfinder. As in B, MEF cell data for Chr 18. Below the RT and LAD data are the nucleolar/genomic ratios from cross-linked (XL) experiment #26 and the peaks called by NADfinder (default cutoff q < 0.05), followed by the analogous data from non-cross-linked (nonXL) experiment #29. Next are shown comparisons of peaks called by the bioinformatic packages MACS2 (broad peaks setting), EDD (50-kb-sized bins), hiddenDomains (50-kb-sized bins), and normR (50-kb-sized bins, v1 < 0.01, q < 10 × 10−3). All software tested except NADfinder called almost the entire chromosome as peaks. NADs called by NADfinder generally correlate with LADs and late RT. (D) As in C, showing Chromosome 5. Note the gradual decrease in the ratio going from left to right (away from the centromere on the left of this acrocentric chromosome). Unlike MACS2 and EDD, NADfinder was able to call peaks on regions distal from the centromere. (E) A shorter chromosomal region, ∼1.3 Mb from Chr 11qA1, analyzed with the same tracks as C and D, plus MEF RNA-seq data at the bottom (GSM2453367, GSM2453368). This region encompasses a gap (red box) between two NADs identified by NADfinder, but was predicted to be part of a single large NAD region by EDD, hiddenDomains, and normR. Note the transcribed genes within the boxed gap. (F) As in C, showing a distal telomere-proximal 2.5-Mb region of Chr 7, including the Kcnq1 locus. This locus has previously been shown to associate with nucleoli (Pandey et al. 2008; Fedoriw et al. 2012a). Of the bioinformatics programs used, only NADfinder correctly called this locus as a peak. (G) As in F, showing a 2-Mb region of Chr XqE. Note the flat level of nucleolar enrichment across this region. The red bar at the top is probe pPK831, a BAC that was observed to be negative for nucleolar association in DNA-FISH experiments (see Fig. 3). This region was correctly called negative by NADfinder, but incorrectly identified as positive by EDD, hiddenDomains, and normR.


