
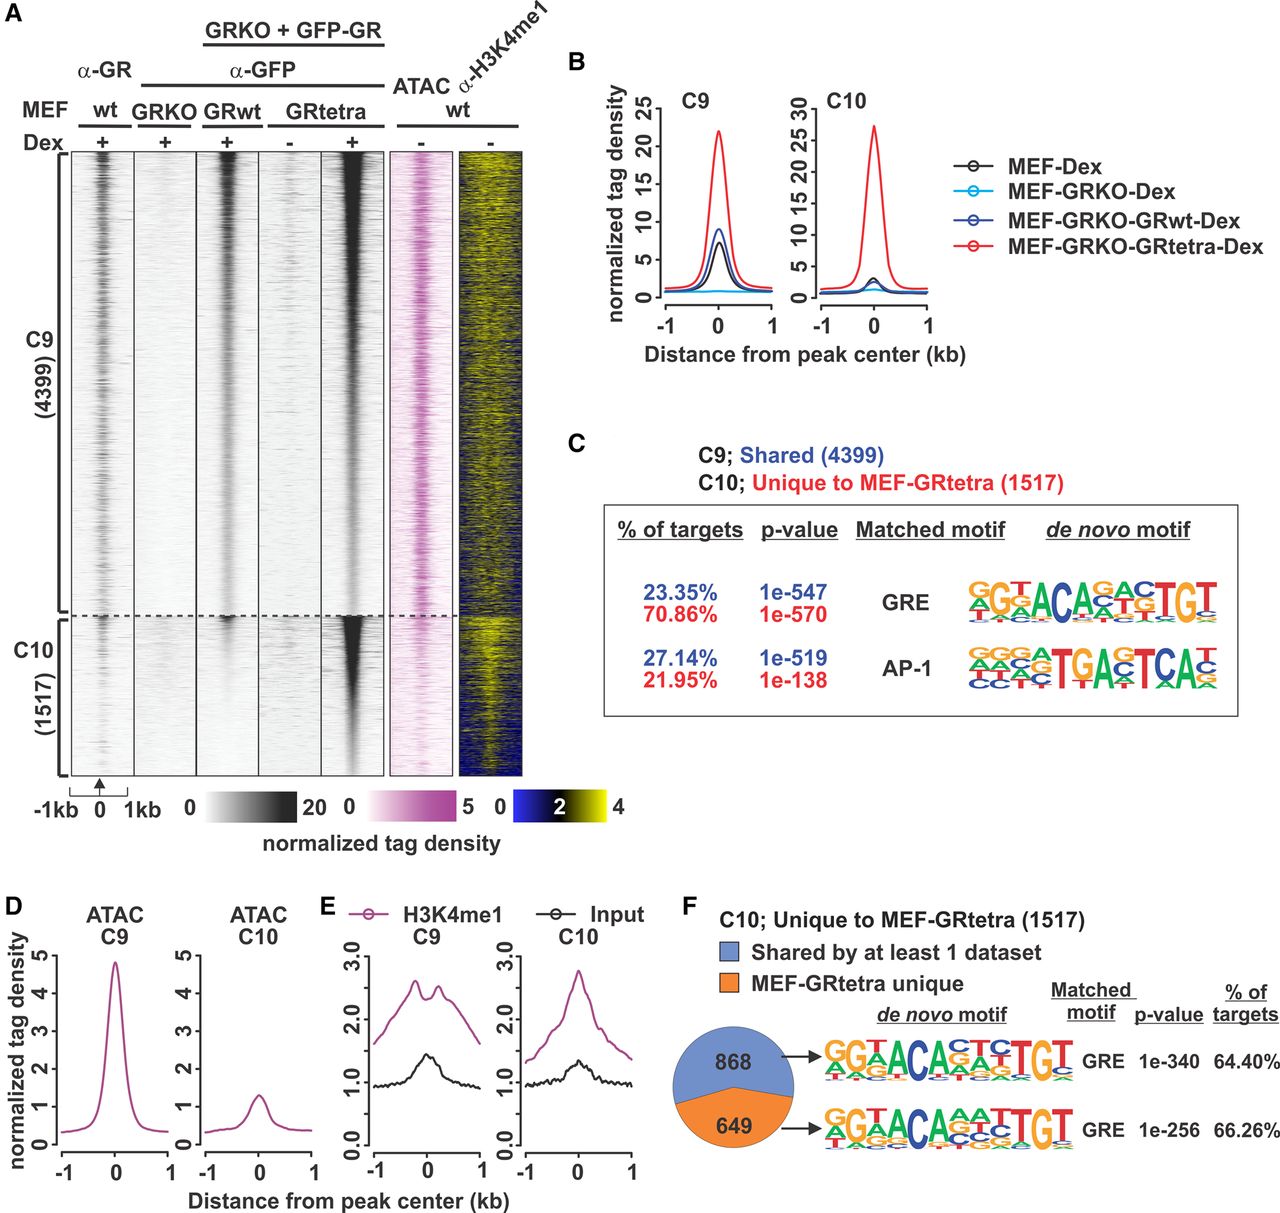
Properties of GRtetra are retained in MEFs. (A) Comparison of endogenous GR in MEFs, reintroduced GRwt, and GRtetra binding in GRKO MEFs reveals two clusters, C9 (shared by MEF-GRwt and MEF-GRtetra) and C10 (MEF-GRtetra–specific sites). Each heat map represents ±1 kb around the center of the GR peak. Binding intensity scale is noted below on a linear scale. A two-color binding intensity scale is used for the histone modification data. Heat maps are sorted based on MEF-GRtetra GFP ChIP-seq binding intensity. (B) Aggregate plots of +Dex GR binding (anti-GFP, or anti-GR for wild-type MEFs) for each cluster; color indicates cell type with endogenous GR, GRKO, or MEFs expressing GRwt or GRtetra. (C) De novo motif analysis as in Figure 1B. Full list of enriched de novo motifs is shown in Supplemental Table S2. (D) Aggregate plots of ATAC-seq tag density in untreated MEFs for each GR binding cluster. (E) Aggregate plots of H3K4me1 ChIP-seq and input tag density in untreated MEFs for each GR binding cluster. (F) Pie chart showing C10 sites unique or shared with at least one published GR ChIP-seq data set. De novo motif analysis of the most enriched motif shown on the right.


