
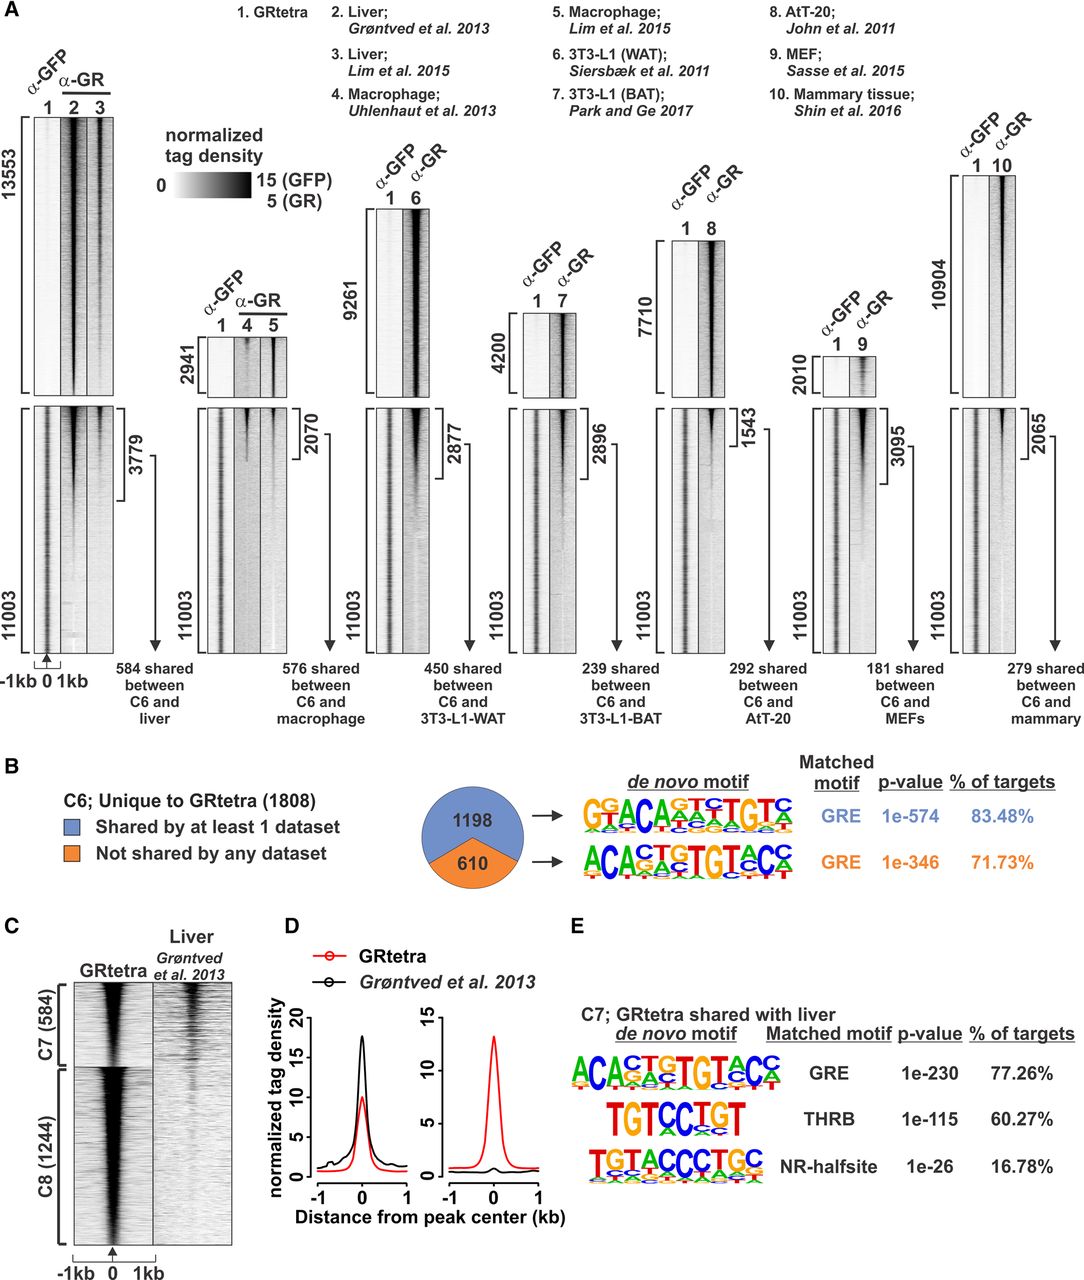
GRtetra unique binding sites are occupied by the receptor in other cell types. (A) Heat map comparison of all GRtetra binding sites (1) to endogenous GR binding sites in other cell types (2–10). Data set information shown on the top of the heat maps. Each cell type was separated into its own heat map. Top heat maps show cell-type–specific binding sites not occupied by GRtetra. The peak number is shown on the left. Lower heat maps show all GRtetra binding sites and the overlap with other cell types. The peak number overlapping between the GRtetra (C4–C6 sites) and the other cell type is shown on the right of the lower heat map. The number of peaks shared between C6 (GRtetra specific) and the other cell type is indicated with an arrow on the bottom of the heat map. Heat maps are sorted by GR ChIP-seq binding intensity in the other cell line. (B) Pie chart showing C6 sites unique or shared with at least one published GR ChIP-seq data set. De novo motif analysis of the most enriched motif shown on the right. Full list of enriched de novo motifs is shown in Supplemental Table S2. (C,D) Heat map (C) and (D) aggregate plots of C6 sites compared with published mouse liver GR data set reveal two clusters, C7 (common to both GRtetra unique sites [C6] and GR binding sites in liver) and C8 (unique GRtetra sites not shared with GR data in liver). (E) De novo motif analysis of C7 sites. Full list of enriched de novo motifs is shown in Supplemental Table S2.


