
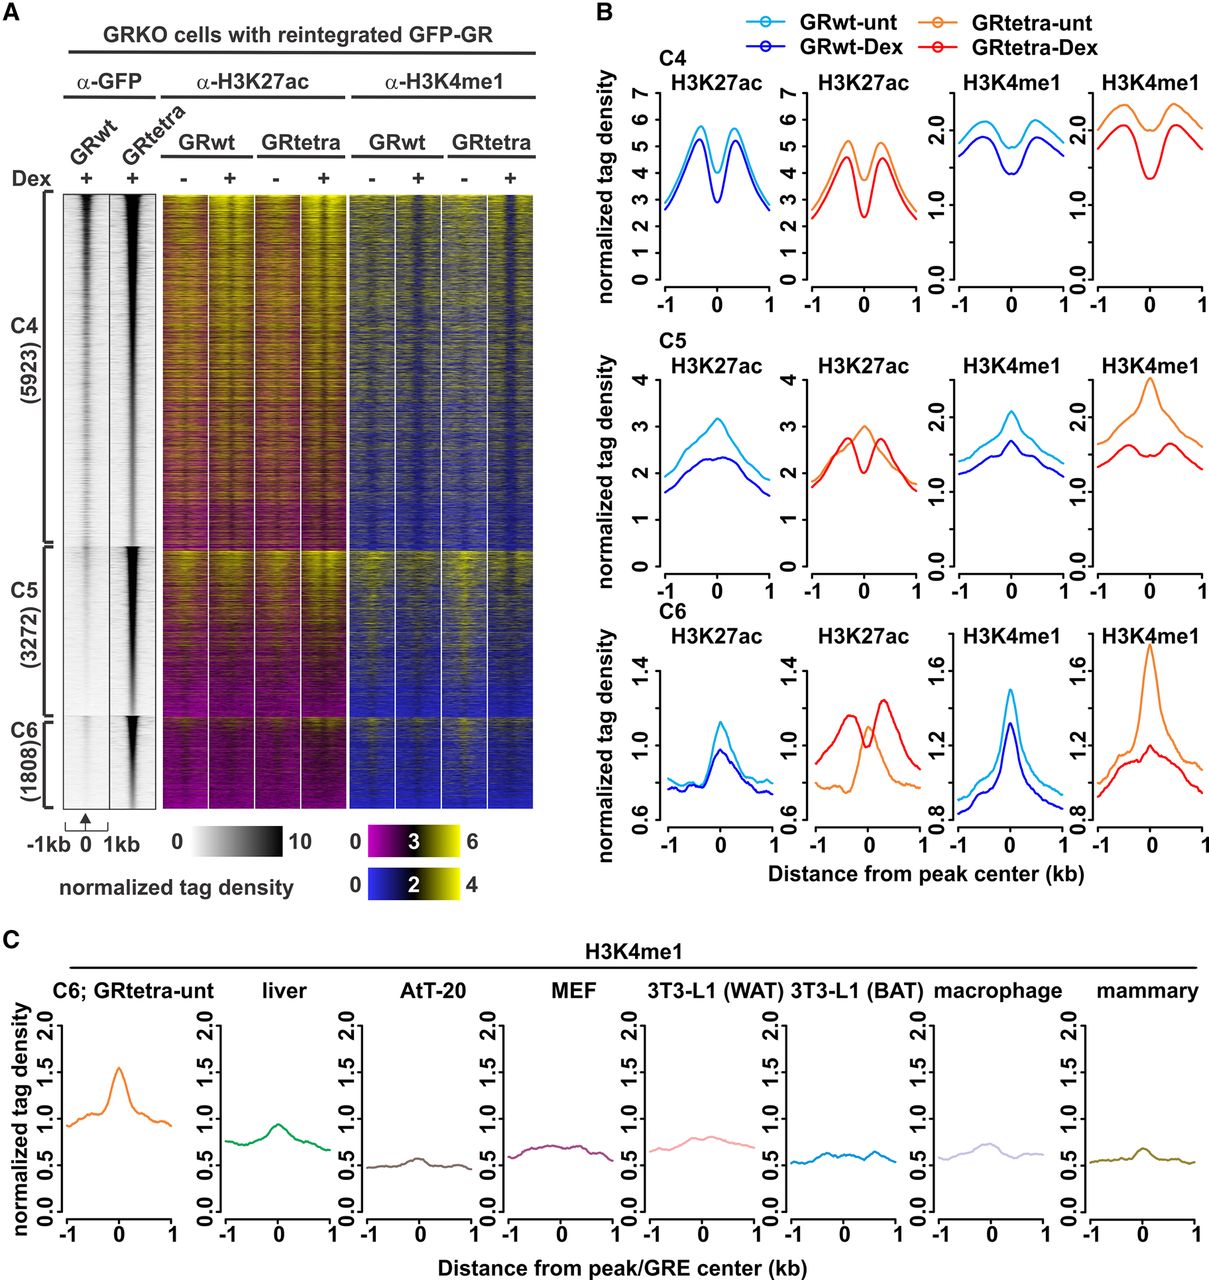
Active and poised enhancer marks at GRtetra binding sites. (A) ChIP-seq data of H3K27ac and H3K4me1 at clusters C4–C6. GR binding is represented as in Figure 1A. A two-color binding intensity scale is used for the histone modification data on a linear scale. (B) Aggregate plots represent histone modification changes for each cluster; color indicates treatment and GR type. (C) Aggregate plots show the comparison of GRtetra H3K4me1 enrichment in untreated cells at C6 sites to GR binding sites present in other cell lines not shared with GRtetra cells. AtT-20 (pituitary), mouse embryonic fibroblast (MEF), and 3T3-L1 differentiated toward white (WAT) or brown (BAT) adipose tissue. Peaks used in the analyses harbored a GRE at the center of the peak.


