
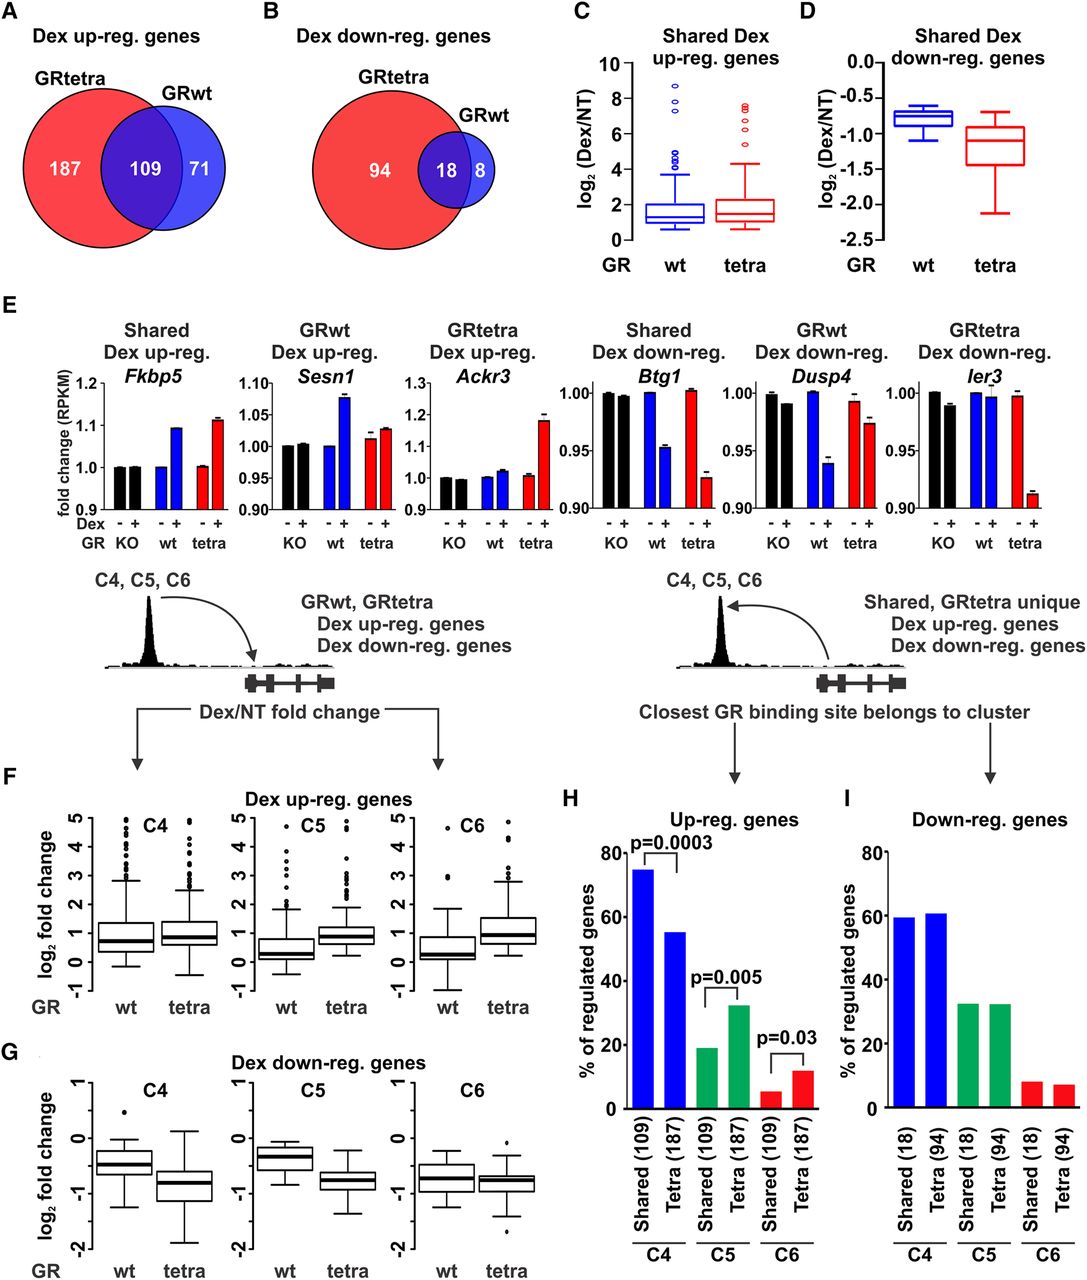
Gene expression analysis of tetrameric GR mutant. (A,B) Venn diagrams of up-regulated or down-regulated genes from RNA-seq data after 2-h Dex treatment. (C,D) Box plots represent the log2 fold change of the 109 (up-regulated) or 18 (down-regulated) GRwt and GRtetra shared genes. (E) Examples of Dex-regulated genes from each subset. Data shown as fold change of RNA-seq RPKM values for GRKO, GRwt, and GRtetra cells. For each cell line, the nontreated sample was used as reference point. (F,G) C4–C6 sites were associated to the nearest Dex up-regulated gene (F) or Dex down-regulated gene (G) based on linear proximity. Box plots represent log2 fold change (Dex/NT) of the Dex-regulated gene in GRwt- and GRtetra-expressing cells that are associated with GR binding sites in C4 (left), C5 (middle), or C6 (right). All box plot comparisons are normalized to total of 10 million reads. (H,I) Shared and GRtetra uniquely Dex up-regulated (H) or Dex down-regulated (I) genes were associated to the closest GR binding site in one of the C4–C6 clusters. Bar graph represents the percentage of regulated genes associated closest with GR binding site of the three clusters. P-values are calculated using χ2 test.


