
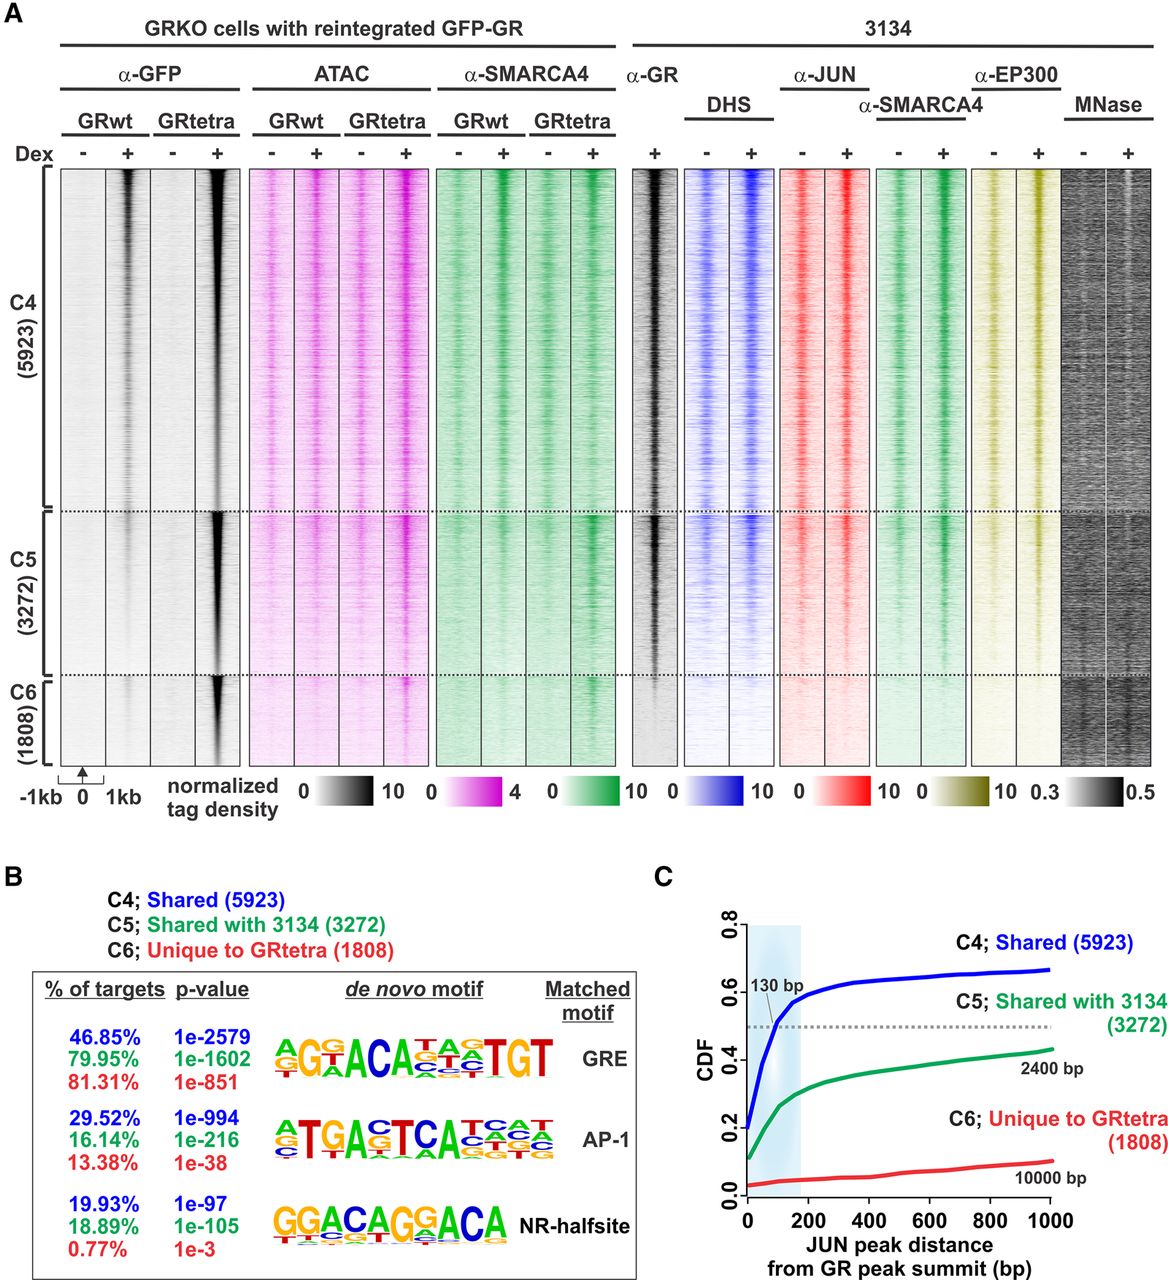
Chromatin analysis of tetrameric GR mutant. (A) Comparison of GRwt and GRtetra binding reveals three clusters, C4–C6: C4, shared by GRwt and GRtetra; C5, shared by endogenous GR in 3134 cells and GRtetra; C6, GRtetra-specific sites. Heat maps represent ChIP-seq, ATAC-seq, and MNase-seq data as indicated. Each heat map represents ± 1 kb around the center of the GR peak. Binding intensity scale is noted below on a linear scale. Heat maps are sorted based in GRtetra binding intensity. All heat maps are normalized to a total of 10 million reads and further to local tag density. (B) De novo motif analysis. The percentage of sites with a motif, P-value of enrichment, and position-weight matrix (PWM) are shown. A full list of enriched de novo motifs is shown in Supplemental Table S2. (C) Cumulative distribution function (CDF) between C4–C6 binding sites and JUN (AP-1) peak in 3134 cells. Each cluster is color-coded with median distance shown for each cluster. Gray dashed line depicts median.


