
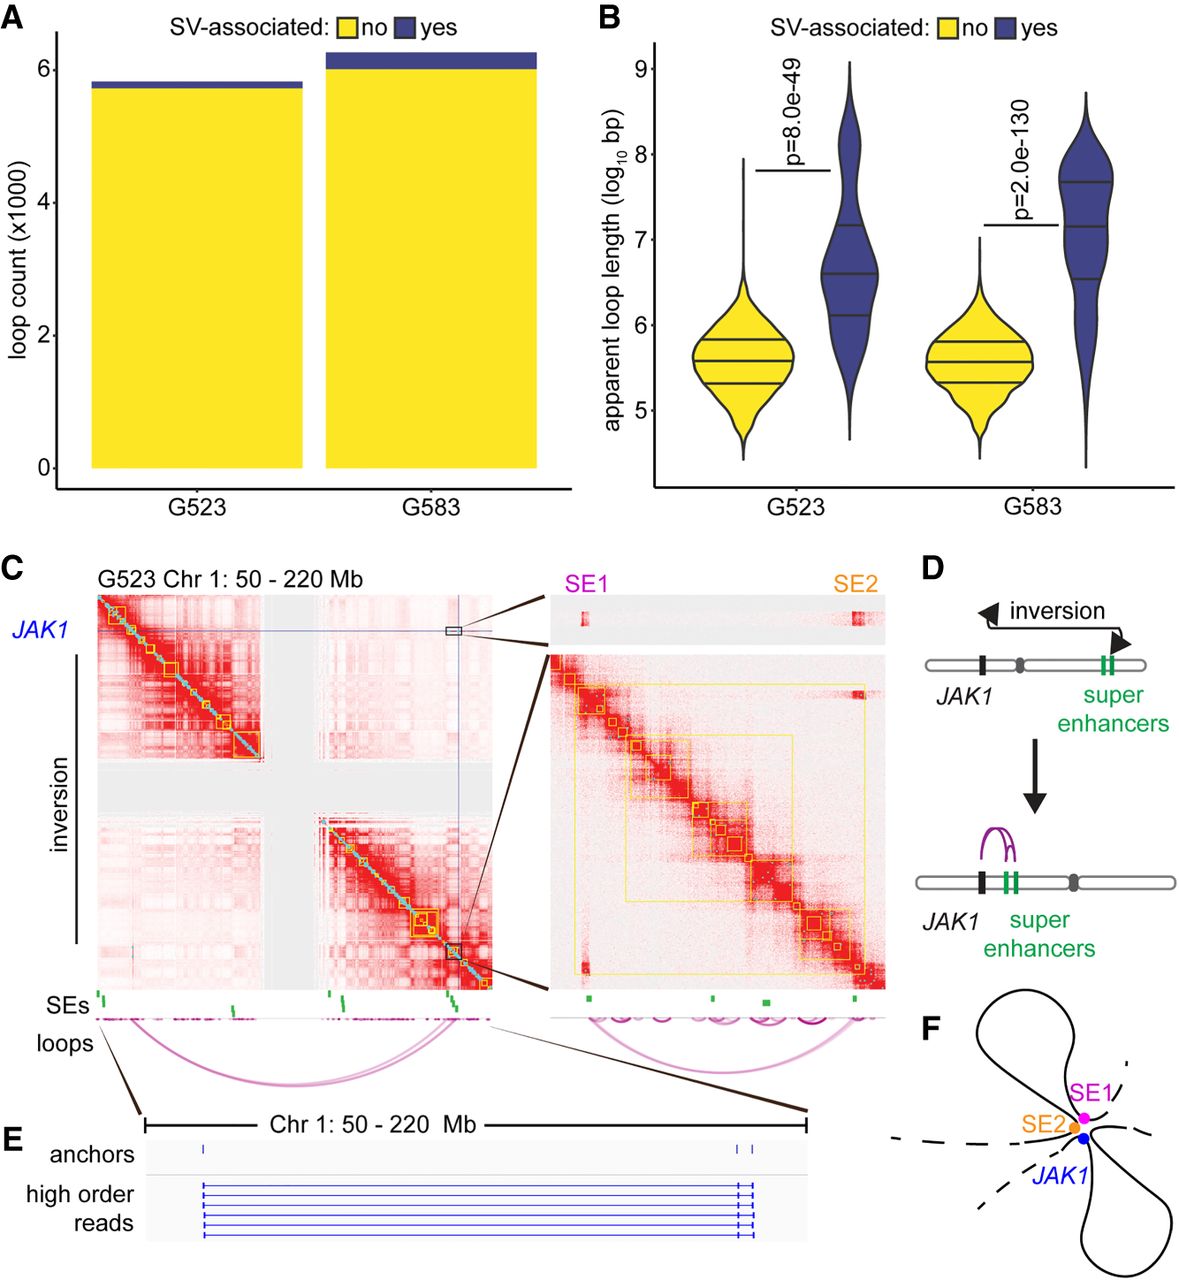
Genomic rearrangements cause differential superenhancer interactions in GSCs. (A) Number of loops associated with local SVs. Loops called by HiCCUPS as 5-kb–100-kb resolution merged loops throughout this figure. (B) Loop length separated by SV status. SV-associated loops tend to connect genomic loci separated by a much larger apparent distance, although this is unlikely the true molecular distance following chromosomal rearrangement. P-values calculated by Wilcoxon rank-sum test. (C) Hi-C contact maps assuming a standard chromosomal order indicate the formation of a ∼140-Mb loop connecting JAK1 to two superenhancers at the other end of Chromosome 1. The central gray region lacks signal throughout due to repetitive pericentromeric regions with ambiguous sequence alignments. Contact maps displayed at 250-kb resolution for the left panel and 5-kb resolution for the right panels. Loops represent the union of 5-, 10-, and 25-kb HiCCUPS calls. (D) Schematic indicating how a large inversion brings the superenhancers and JAK1 in close proximity. (E) Chimeric reads aligning to JAK1 and both superenhancers. Additional higher-order reads were detected, but not all are displayed due to redundancy. (F) Diagrammatic representation of the convergence of two SEs (SE1 and SE2) to the JAK1 locus in G523.


