
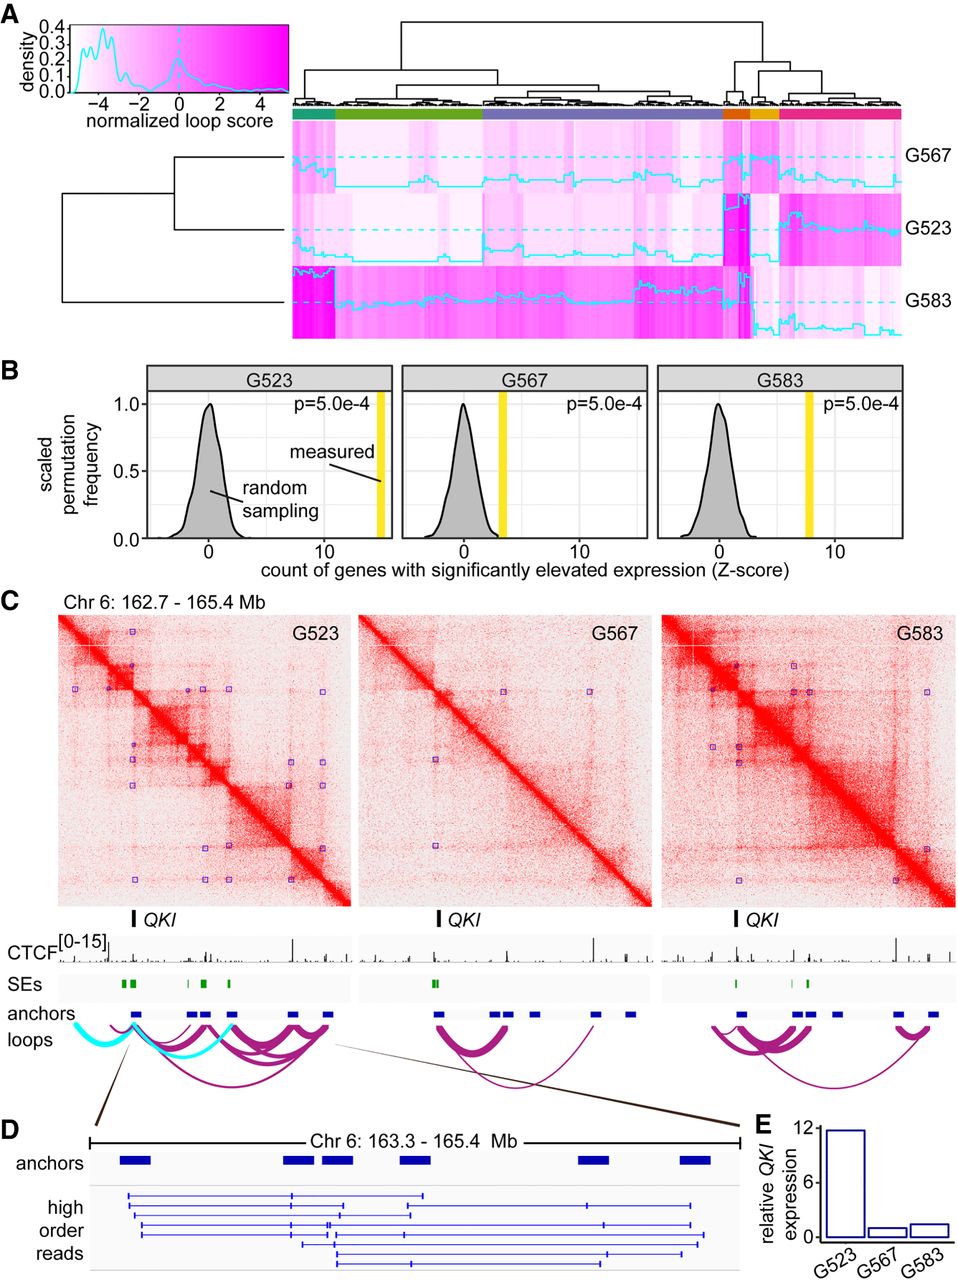
Culture-specific loops promote gene expression in GSCs. (A) Heat map of loop scores for loops in the top 2% of variance between cultures. Top multicolored bar indicates clusters of loops with shared patterns of differential representation between the cultures. Loops called by HiCCUPS as 5-kb–100-kb resolution merged loops throughout this figure. (B) Enrichment for genes with elevated expression at culture-specific loops. Gray curve: frequency of detecting significantly elevated expression determined by 2000 permutations of randomly sampled expression values from genes with nonunique loops. Vertical bar: measured number of differentially expressed genes found overlapping culture-specific loops, expressed as Z-score. (C) Hi-C contact maps for G523, G567, and G583 surrounding the QKI locus displayed at 5-kb resolution. Green track: superenhancers called using ROSE. Purple arc tracks: loops identified by HiCCUPS (union of 5-, 10-, and 25-kb calls) with thickness proportional to loop score. Cyan arc tracks: culture-specific loops to QKI present in G523. (D) Chimeric reads derived from the same DNA fragment that aligns to more than two loop anchors. (E) Expression of QKI in G523, G567, and G583 was determined by RNA-seq. Y-axis represents read counts normalized to G567 to give fold enrichment values.


