
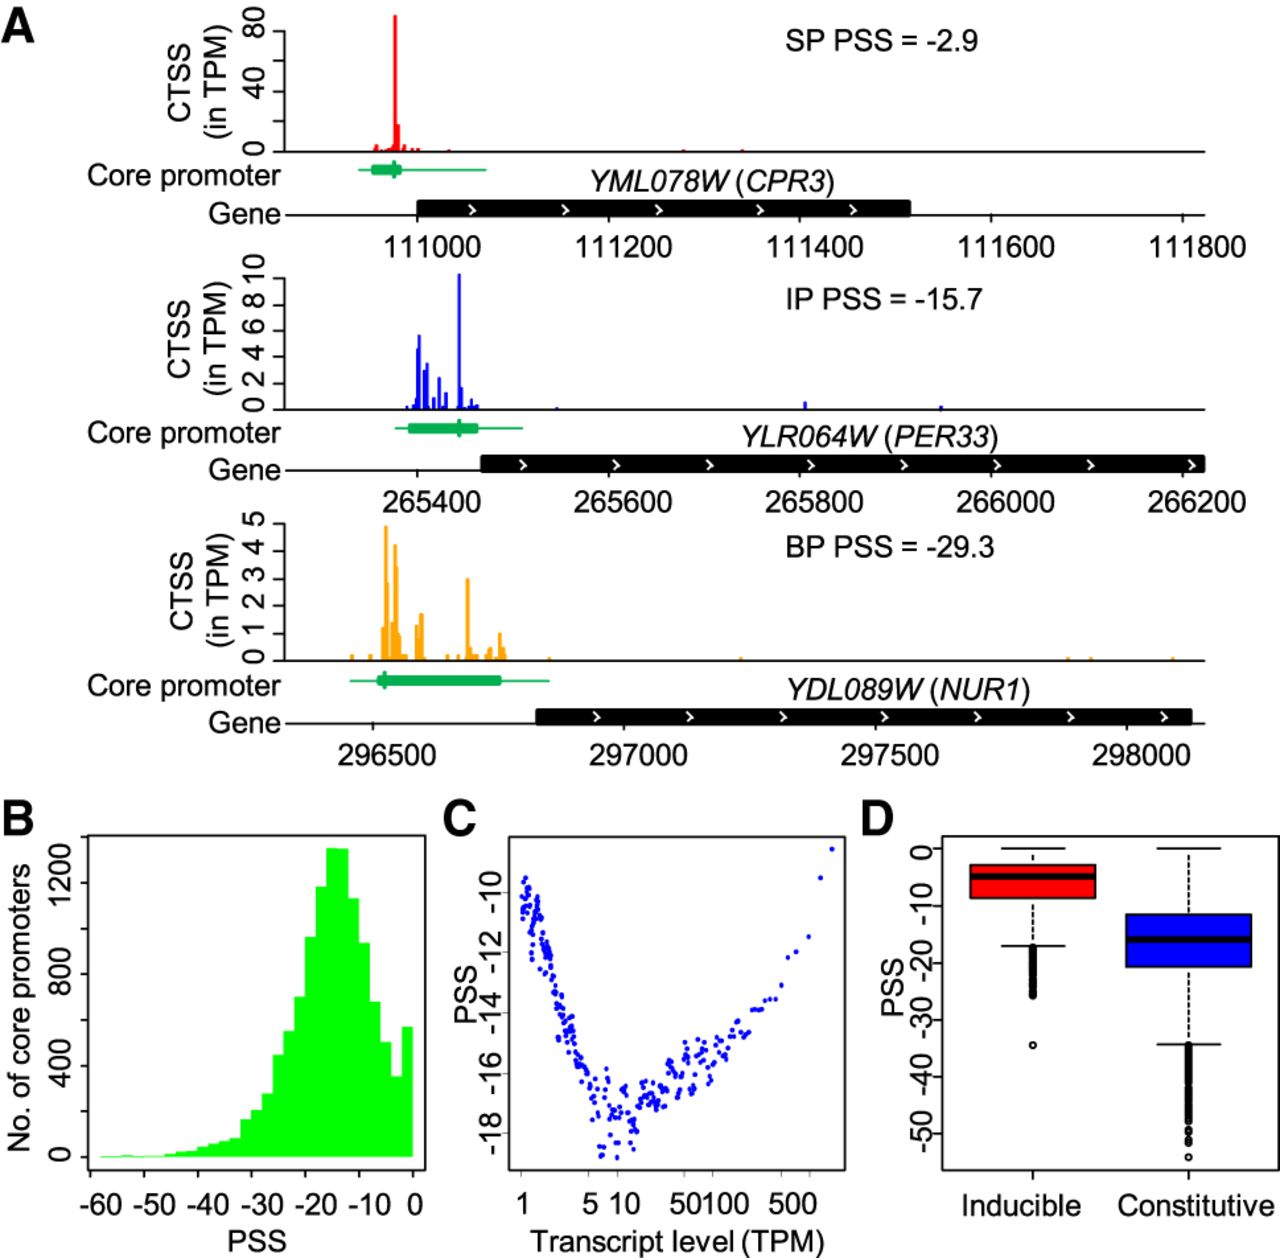
Classifications of core promoter shape. (A) Examples of sharp, intermediate, and broad core promoters in S. cerevisiae. Core promoters with PSS greater than −10 were classified as sharp core promoters (SP), smaller than −20 as broad core promoters (BP), and the others as intermediate core promoters (IP). (B) Histogram shows the distribution of PSS values in S. cerevisiae. (C) Relationships between the transcript abundance and PSS values of core promoters. The dot plot was generated using a sliding window analysis after sorting all core promoters by transcript abundance (TPM). Each window has 200 core promoters with a moving step of 40 core promoters. Each dot presents the median values of PSS and TPM of each window. (D) A box plot of PSS values of inducible core promoters and constitutive core promoters.


