
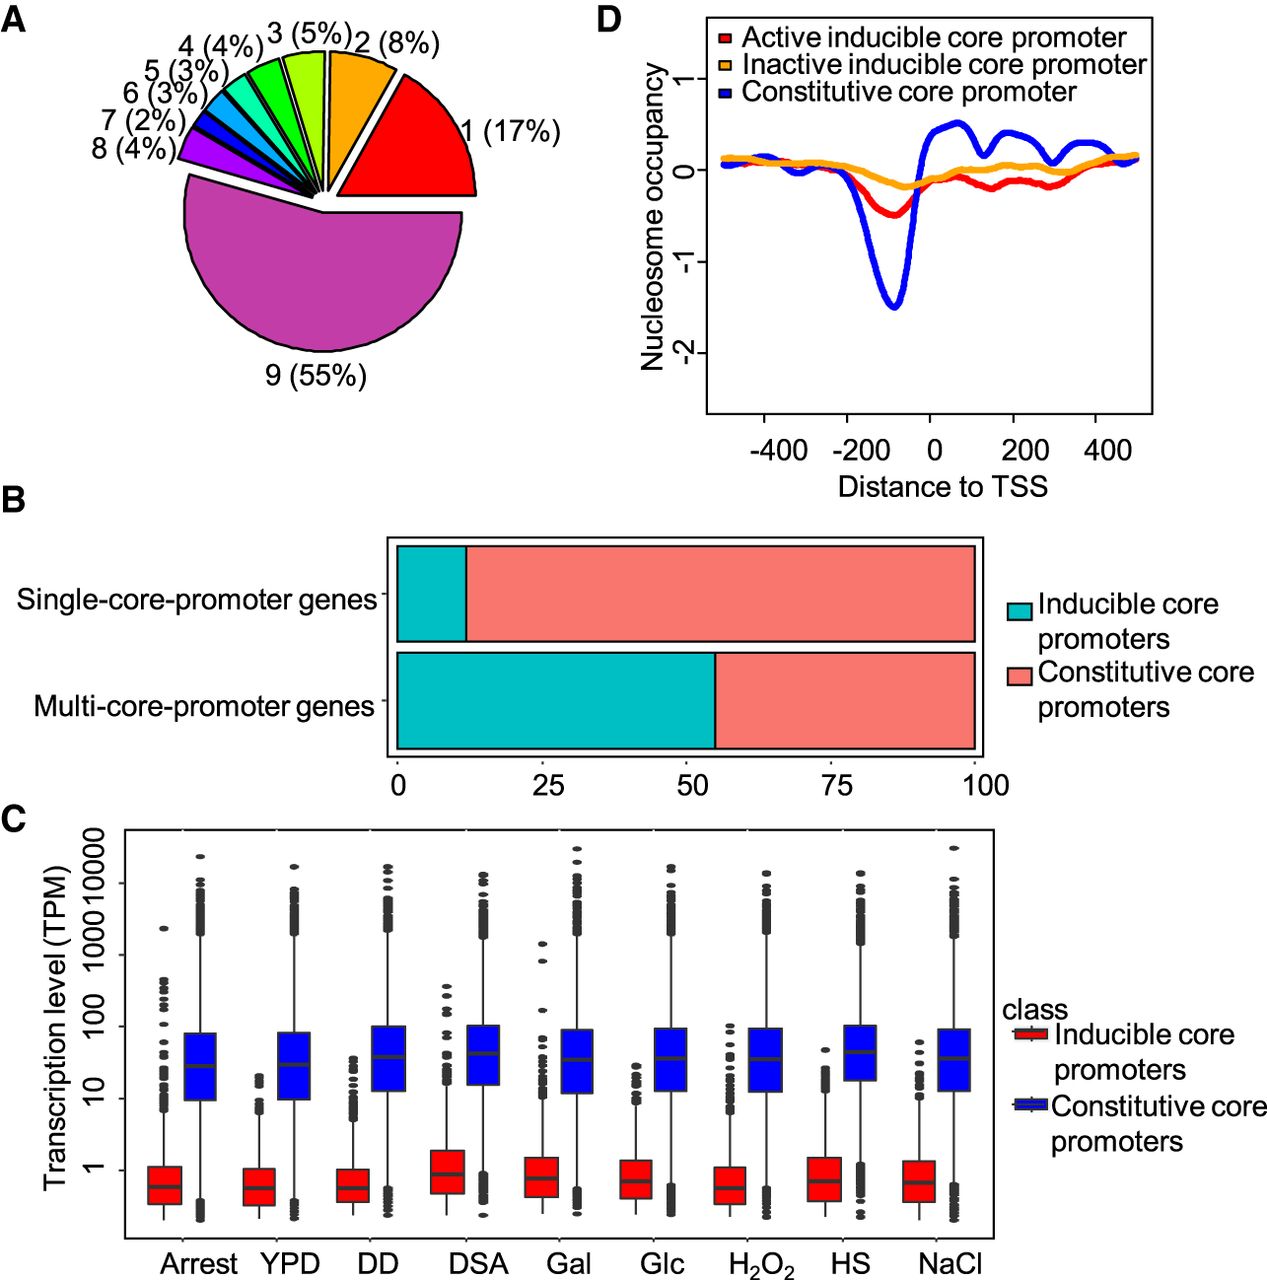
Figure 4.
Distinct properties of constitutive and inducible core promoters in S. cerevisiae. (A) Pie chart shows the fractions of core promoters that can be detected in different numbers of growth conditions. Numbers in the pie chart represent the numbers of growth conditions. (B) Core promoter compositions in single- and multi-core-promoter genes. (C) Transcript abundance of constitutive core promoters and inducible core promoters in all examined growth conditions. (D) Patterns of nucleosome occupancy around dominant TSSs of different types of core promoters. The nucleotide occupancy data were obtained in rich medium (YPD).


