
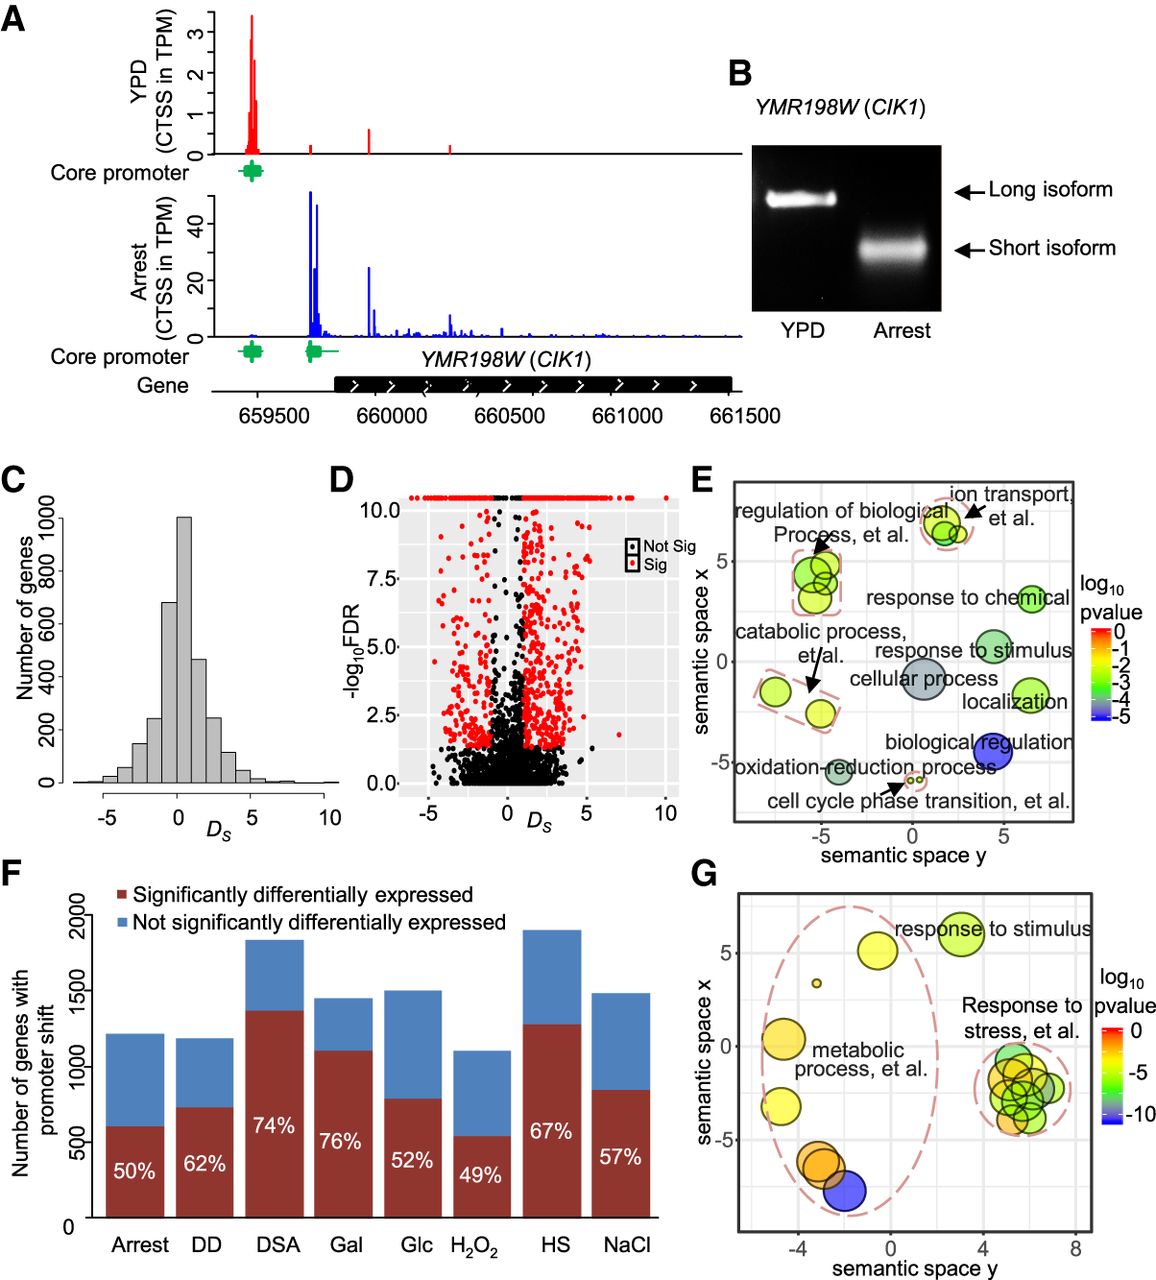
Prevalent core promoter shift responding to changing environments. (A) An example of core promoter shift (CIK1) between two growth conditions, YPD and arrest. (B) Experimental validation displays the presence and shift of two CIK1 transcript isoforms in response to changing environments. (C) Distribution of “degree of shift” (Ds) values in “H2O2” growth condition, using “YPD” as a control. (D) Volcano plot displays the correlations between Ds and −log10 FDR values (χ2 test). Each dot represents one gene. Dots in red represent genes with significant promoter shift (FDR < 0.05 and Ds < −1 or Ds > 1). (E) Scatterplot of enriched GO terms with significant core promoter shift (FDR < 0.05 and Ds < −1 or Ds > 1) under H2O2 condition. (F) The proportions of genes with core promoter shift that also experienced differential gene expression in response to environmental cues (FDR < 0.05, DESeq2). The percentages are indicated in each bar. (G) Scatterplot of enriched GO terms with significant core promoter shift and altered gene expression.


