
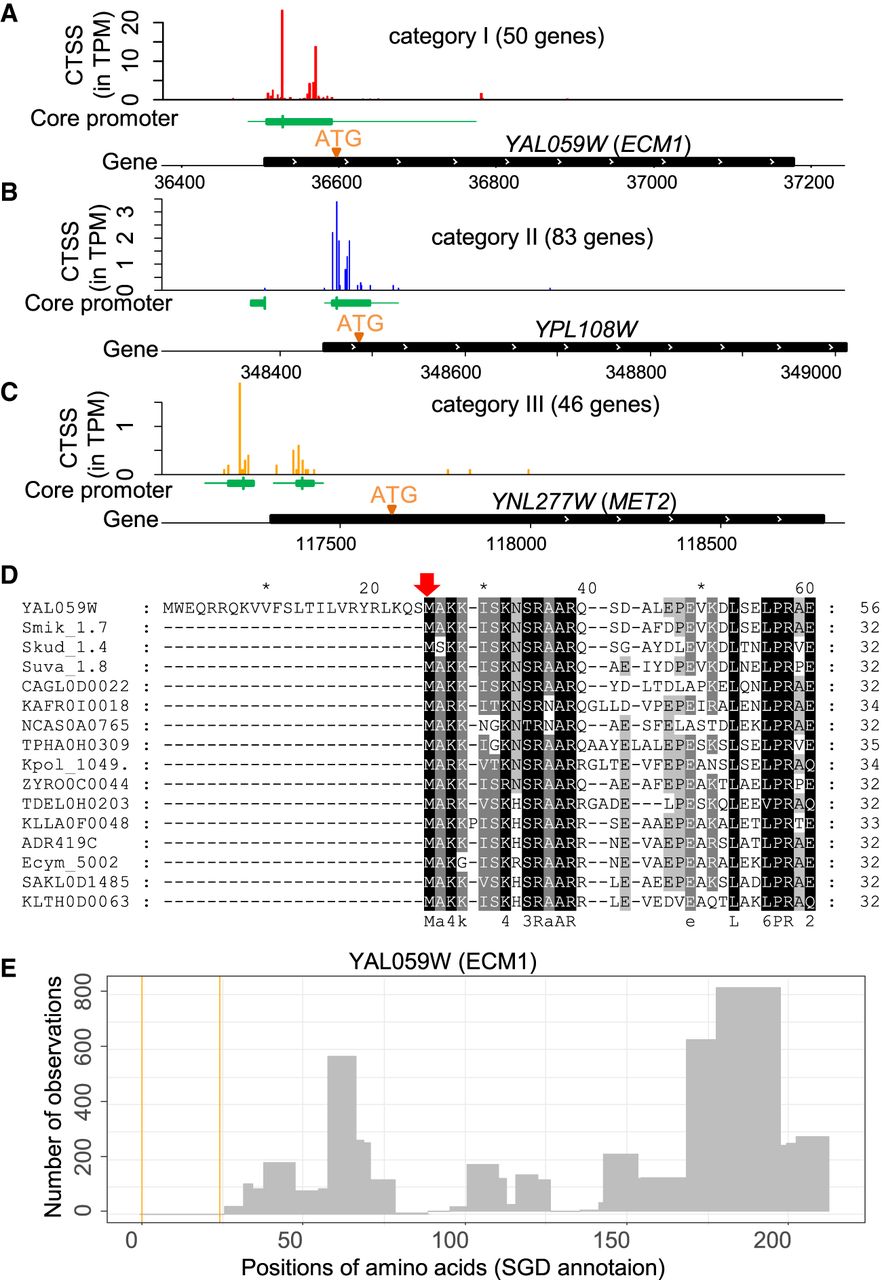
TSS maps improve yeast genome annotation. (A–C) Examples of CAGE signal distribution in Category I, II, and III genes. In each example, the top track illustrates the distributions of CTSS signals near the annotated ORF. The middle track (green box) represents the core promoter region. The vertical line represents the dominant TSS in each core promoter. The bottom track displays the locations of annotated ORF. The originally annotated ATG is at the far side of the black box (ORF). Revised start codon (A,B) or alternative start codon (C) are indicated by “ATG” and an orange triangle. (D) Multiple sequence alignment for orthologous protein sequences of YAL059W (ECM1). Only the first 60 alignment sites are shown. The first 24 amino acids in the N terminus of YAL059W are absent in its orthologous sequences. The red arrow indicates the revised start codon. (E) A histogram shows the number of observations for detected peptides in ECM1. No peptides have been detected by previous mass spectrometry studies in the section between two orange lines, which corresponds to the 24 amino acids of the misannotated region in YAL059W.


