
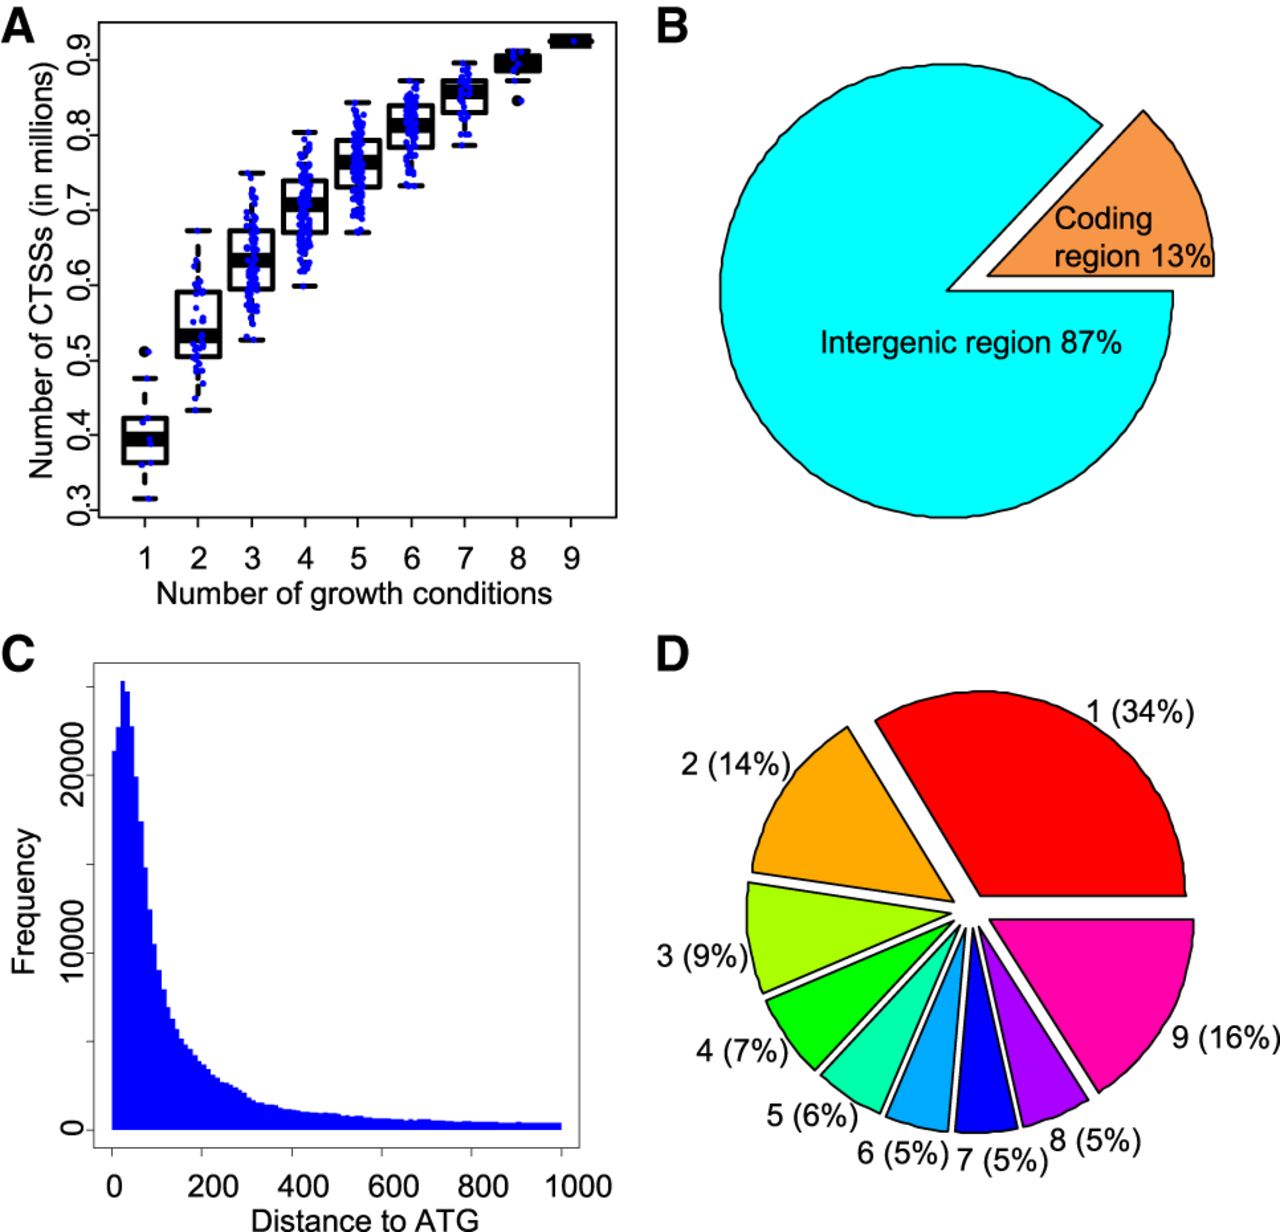
Figure 1.
Pervasive and dynamic transcription initiation in S. cerevisiae. (A) Correlations between numbers of examined growth conditions and identified CTSSs. The x-axis indicates the number of examined conditions. Each dot in the box plots represents the number of identified CTSSs based on a combination of TSS data from N numbers (ranging from 1 to 9) of growth conditions. (B) Distribution of mapped CAGE tags in different genomic regions. (C) Distribution of distance between CTSSs and annotated translation start codon (ATG). (D) Proportions of CTSSs identified in different numbers of growth conditions.


