
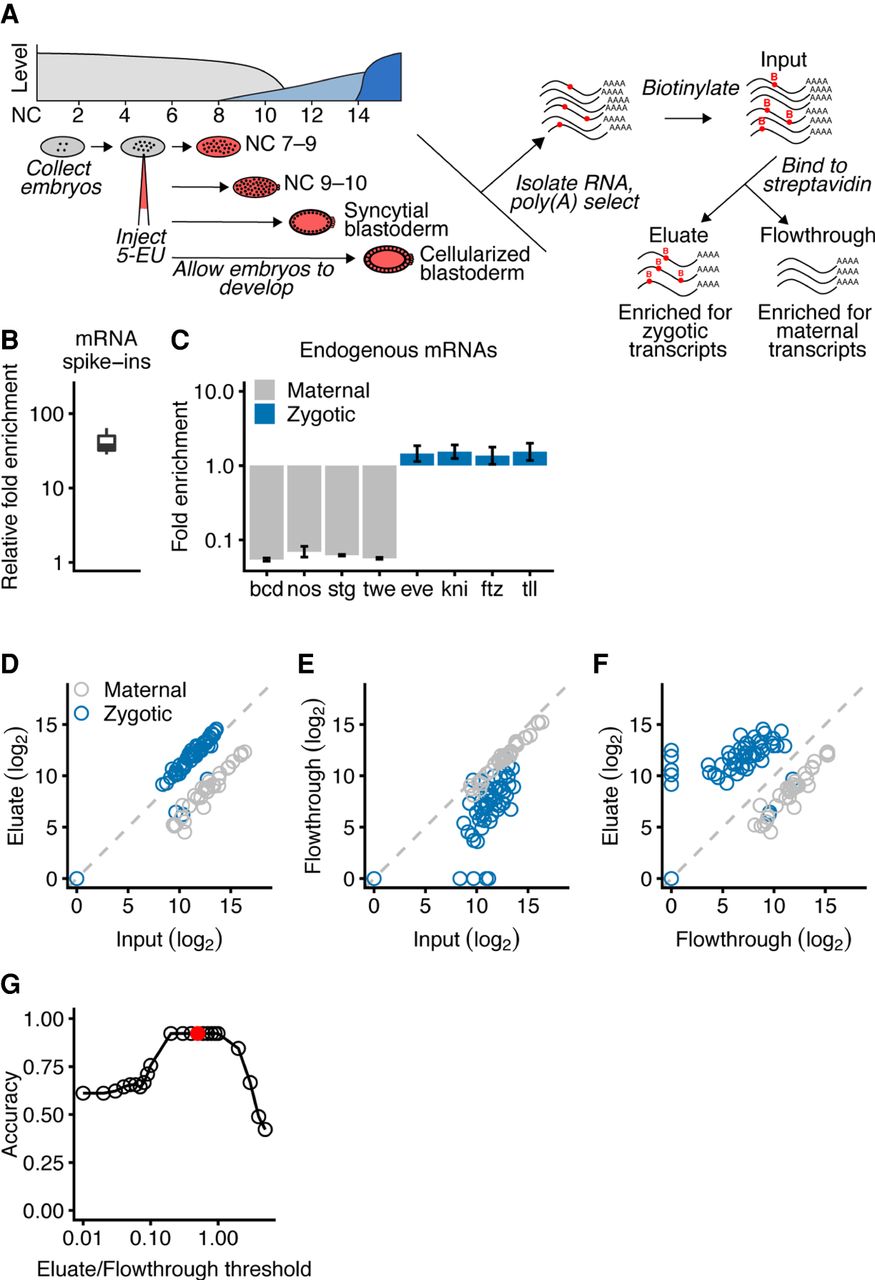
Isolation of zygotic RNAs using metabolic labeling. (A) Schematic of Drosophila ZGA and the protocol used to isolate zygotic RNAs. At the top left is a diagram of Drosophila ZGA, redrawn from Tadros and Lipshitz (2009) but labeling the x-axis using NC number. Maternal transcripts (gray) dominate early, prior to the minor and major waves (light blue and dark blue, respectively) of zygotic transcription. Below the ZGA diagram is a schematic of the protocol. Embryos were collected just after fertilization, injected with 5-EU, given time to develop, and then RNA was harvested at four morphologically defined stages. Total RNA containing both zygotically transcribed RNA, which was labeled with 5-EU (red dots), as well as maternal RNA, which was unlabeled, was isolated and reacted with a biotin-azide reagent. Reacted RNA was incubated with streptavidin beads, and sequencing libraries were prepared from bound RNA (eluate), unbound RNA (flowthrough), and input RNA. (B) Enrichment of 5-EU-containing RNA. For each experiment, the fold enrichment observed in the eluate compared to the input was calculated for a 5-EU-containing standard and normalized to that of the unlabeled standard (line, median; box, quartiles; whiskers, fifth and 95th percentile). (C) Enrichment of zygotic mRNAs (blue) and depletion of maternal mRNAs (gray) in the eluate compared to the input. Analysis is from RNA of embryos in the syncytial-blastoderm stage (error bars, range from two biological replicates). (D) Enrichment of most annotated zygotic mRNAs (blue) and depletion of maternal mRNAs (gray) in the eluate of RNA analyzed from embryos in the syncytial-blastoderm stage. The 57 zygotic transcripts are those annotated by De Renzis et al. (2007); the 35 maternal transcripts were curated from the literature. (E) Depletion of zygotic transcripts from the flowthrough. Otherwise, this panel is as in D. (F) The relationship between transcript level in the eluate compared to that in the flowthrough. Otherwise, this panel is as in D. (G) Discrimination of annotated maternal and zygotic transcripts as a function of their levels in the eluate and flowthrough. Accuracy is calculated as the fraction of the 92 mRNAs assigned an annotation matching that of the literature. The reason it did not reach 1.00 can be attributed to four misannotated mRNAs in the set of zygotic transcripts. The red dot represents the eluate/flowthrough threshold of 0.5, which was used to identify zygotic transcripts in subsequent analyses.


