
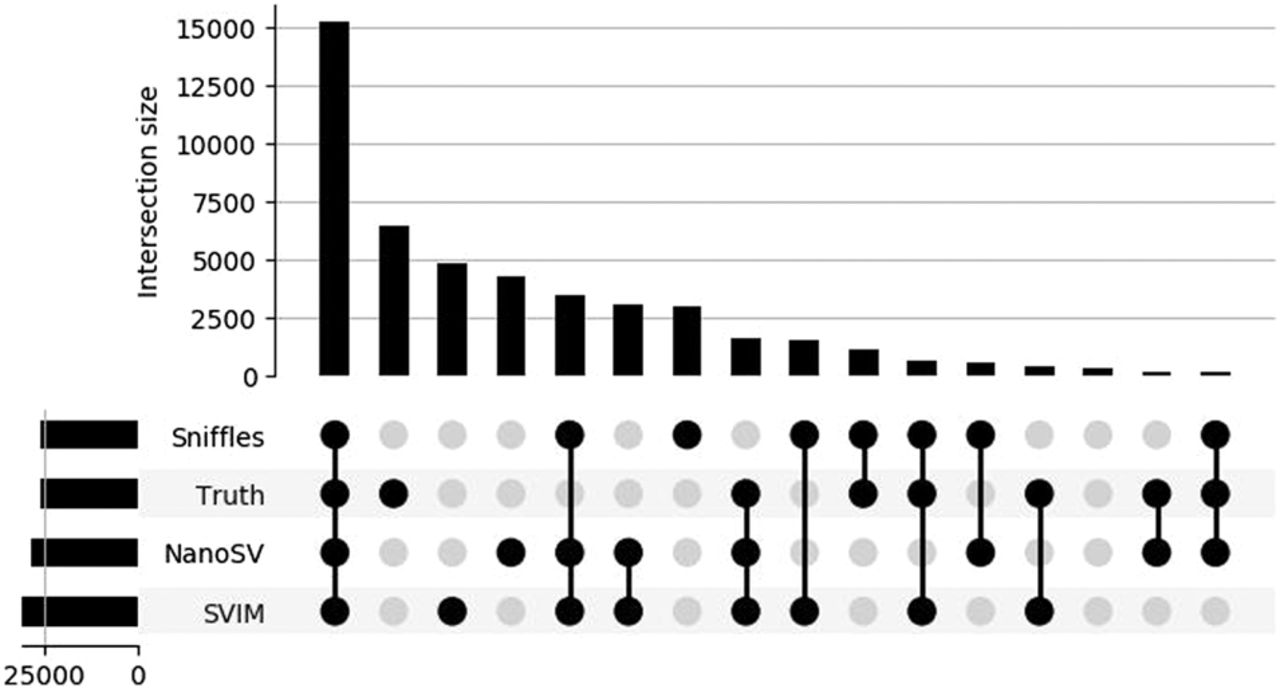
Figure 6.
Upset plot of variant calls obtained after alignment using minimap2. The height of the vertical bars indicates the number of variants in this set overlap, as indicated by the colored dots and connecting lines in the bottom panel. The height of the horizontal bars indicates the total number of variants per set.


