
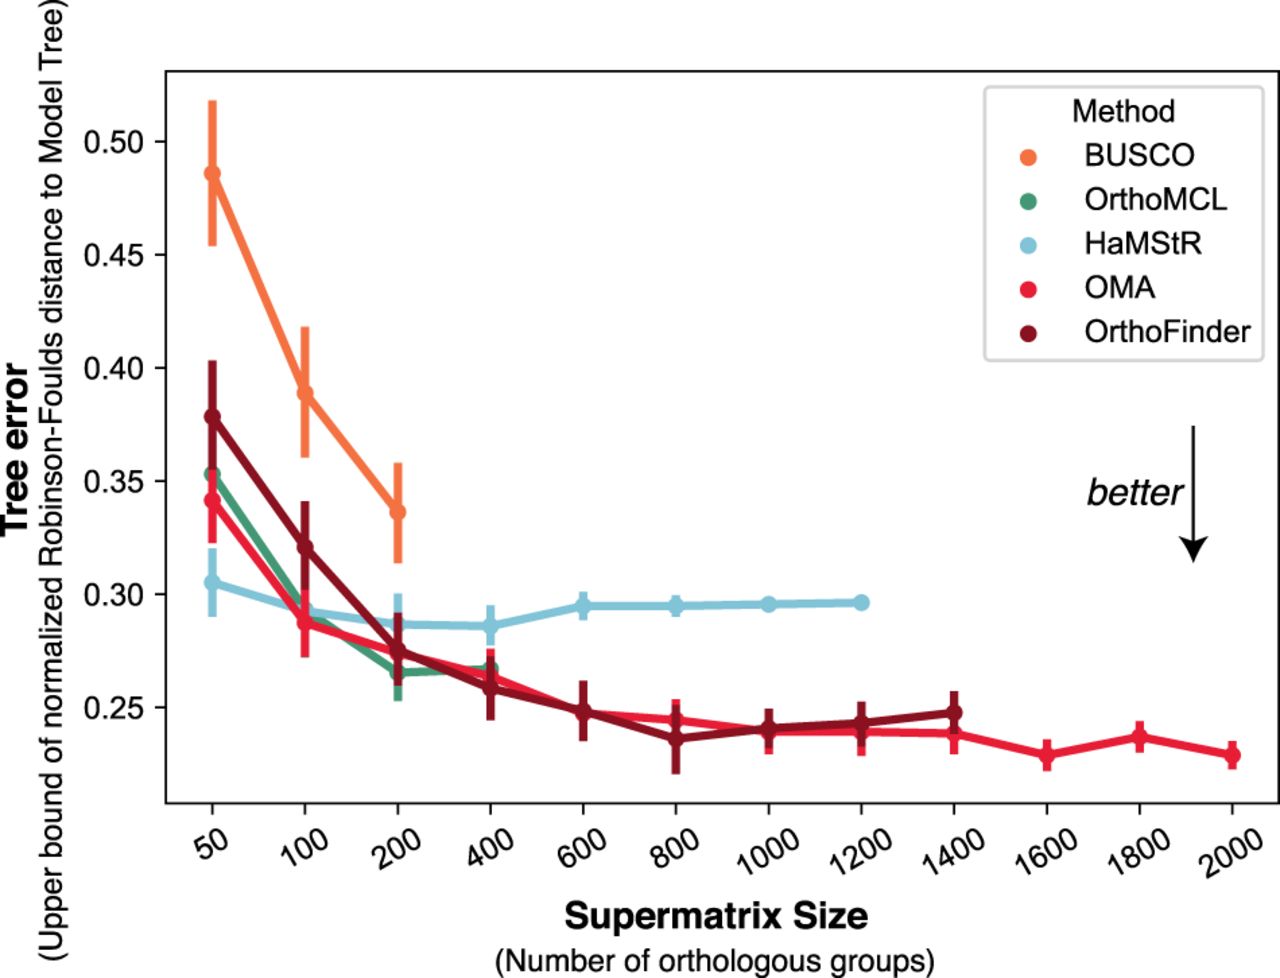
Figure 5.
Accuracy of trees reconstructed with varying number of orthologous groups, on the lophotrochozoan data set, using IQ-TREE with a WAG + I model. Each point is obtained by averaging over results obtained from 50 random group subsets of varying size, drawn without replacement. Even if all methods are downsampled to have the same number of groups, trees obtained from OMA are consistently among the most accurate ones (measured in terms of the Robinson-Foulds distance to a partially resolved reference tree) (see Methods). Error bars depict one standard error on each side.


