
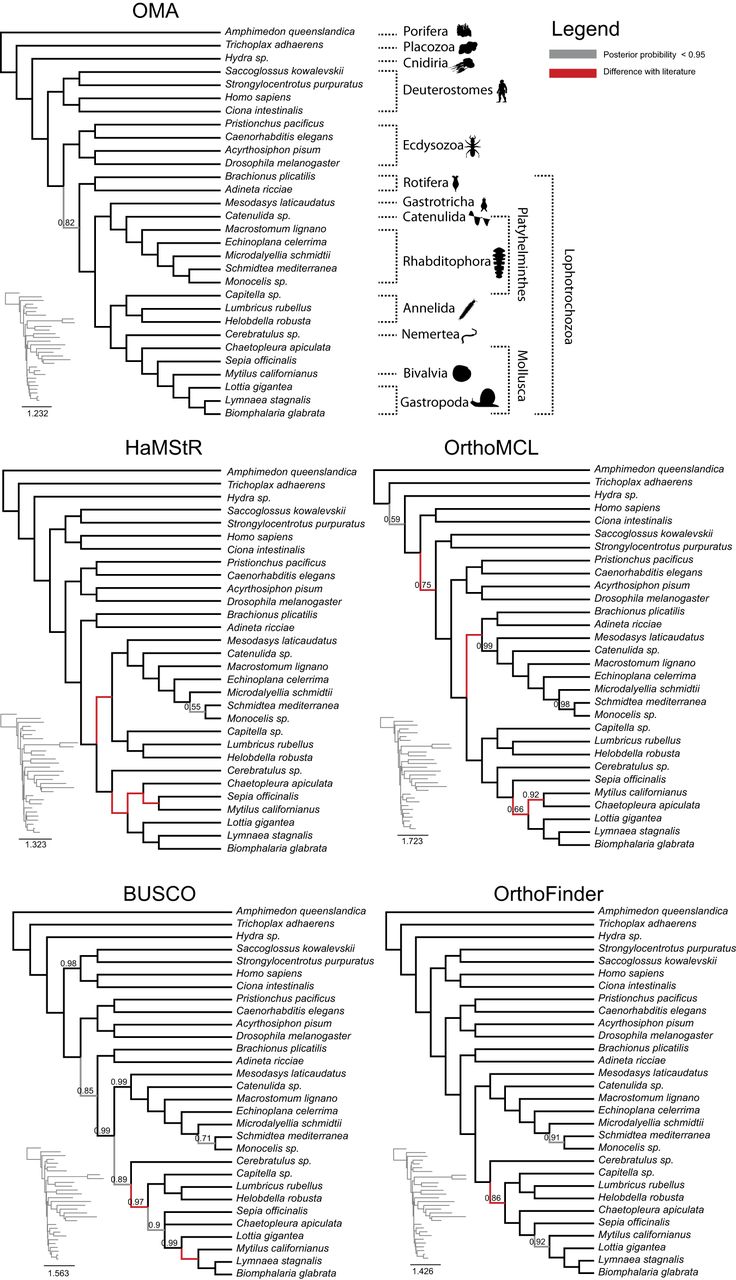
Figure 4.
Comparison of trees obtained using PhyloBayes with the CAT-GTR-G4 model from the different orthology methods. OMA tree is in congruence with published results (see main text). Branches that are at odds with the literature are in red; otherwise they are displayed in gray (posterior probability < 0.95) or else in black. Only posterior probabilities below one are displayed. Please note that the PhyloBayes tree computed from HaMStR data did not converge after 900,000 CPU hours and thus should be interpreted with caution.


