
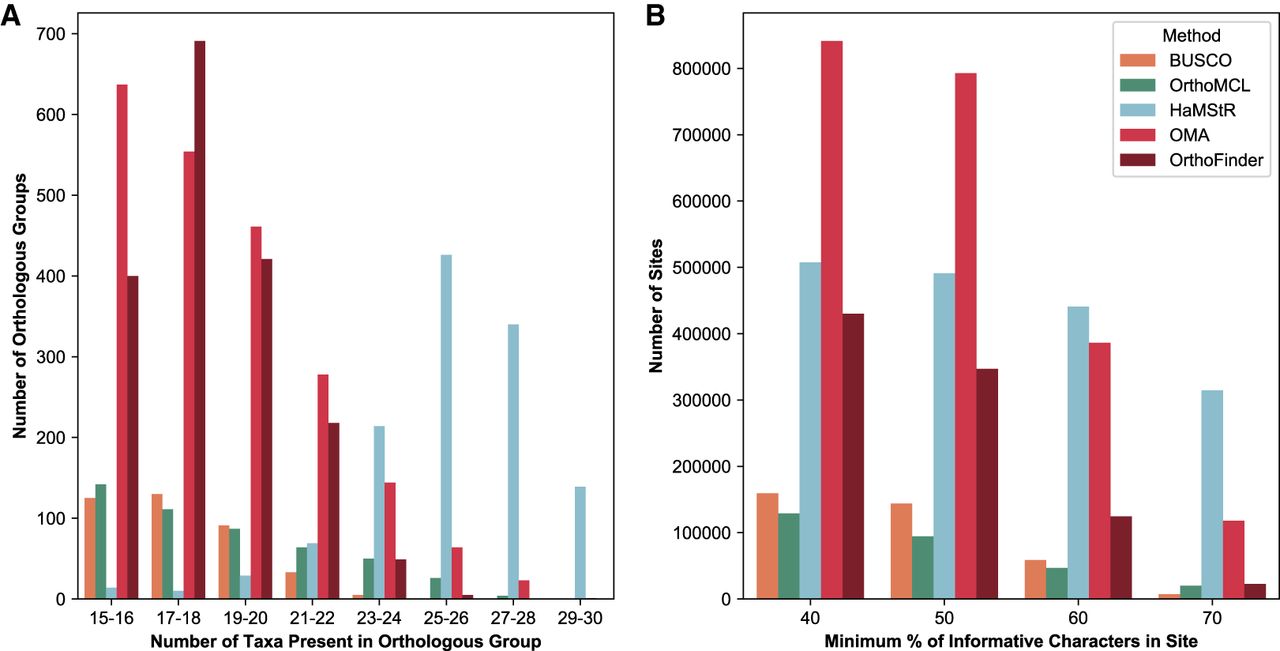
Figure 3.
Comparison of amount of orthologous data inferred by the different pipelines. (A) OMA and OrthoFinder infer more orthologous groups than other methods, whereas the groups inferred by HaMStR are considerably larger on average than for the other methods. (B) The resulting supermatrix has most sites for OMA, whether the minimum site occupancy threshold is 40% or 50%, and most sites for HaMStR at the 60% cutoff (used for phylogenomic reconstruction) and 70% cutoff.


