
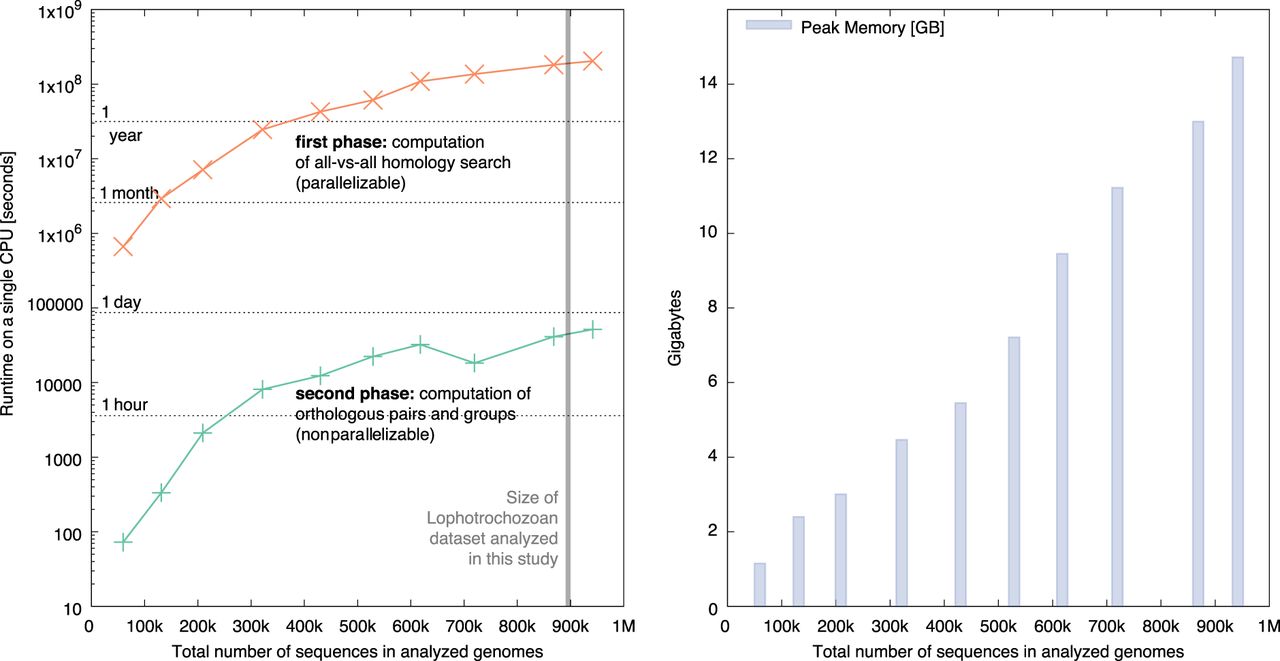
Figure 2.
Resource measurements for various data sets of increasing sizes as total number of protein sequences. The data sets have been sampled from the public OMA Browser to maintain a constant composition of 20% fungi, 10% archaea, 10% plants, 20% metazoan, and 40% bacteria genomes. (Left) Runtime of the all-against-all phase (orange) on a single CPU, and the inference of the orthologous pairs and various groups (green). (Right) Peak memory usage of OMA standalone in gigabytes (GB).


