
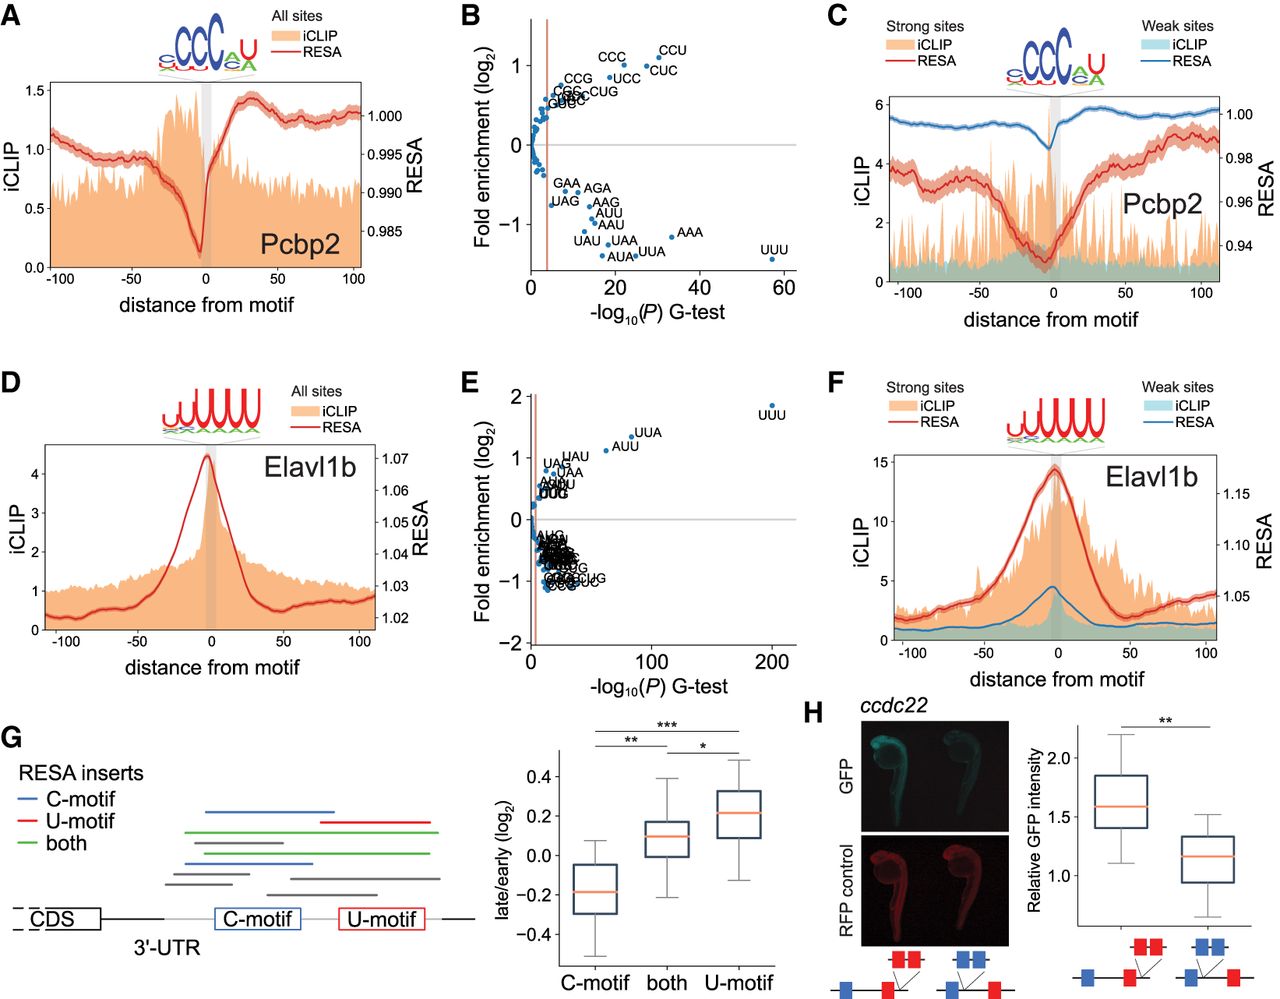
Antagonistic effects of different RBP binding motifs. (A,D) Motif-centered metaplots for Pcbp2 (A) and Elavl1b (D). RESA transcriptome coverage ratio and iCLIP signal were averaged over windows centered on RBP motif (RESA minimum coverage >0.05 CPM). The motif is represented with gray bar. SEM of RESA is shown by red shaded outline. (B,E) Sequence context of RBPs potential target sites. Volcano plot representing 3-mer enrichment 20 nt upstream of and downstream from the motif between the top 10% most destabilizing for Pcbp2 (B) and most stabilizing for Elavl1b (E) and the bottom 10%. P-values were calculated using a G-test. Red line indicates 1% significance cutoff after Bonferroni multiple test correction. (C,F) Motif-centered metaplots for Pcbp2 (C) and Elavl1b (F) comparing potential target sites with favorable context (red) or not (blue). Favorable context defined as top 10% of sites most enriched with significantly enriched 3-mers and least enriched in significantly depleted 3-mers as shown on panels B and E. Scale on y-axis was adjusted, showing higher regulation and wider iCLIP binding signal of sites with favorable context. (G) Schematic describing how to select RESA inserts to measure antagonistic effects of two motifs. Inserts from RESA-targeted overlapping C-motif only, U-motif only, and both motifs are colored in blue, red, and green, respectively. Inserts with a partial overlap in gray are ignored. To estimate stability of inserts, the same procedure is applied for early and late time-points, and the ratio of the number of inserts is calculated (left). Box-and-whisker plots showing stability of inserts overlapping C-rich and U-rich motifs separately and both together (right). (***) P < 0.001; (**) P < 0.01; (*) P < 0.05, Wilcoxon signed-rank test. (H) Zebrafish 24-h embryos injected with [C-rich (blue box) and 3× U-rich motifs (red box)] or [3× C-rich and U-rich motifs] reporters (n = 18 per inserts). Reporter sequence is derived from 3′ UTR of ccdc22 gene. In G and H, boxes span first to last quartiles, and whiskers represent 1.5× the interquartile range. (**) P < 0.01, Mann–Whitney U test.


