
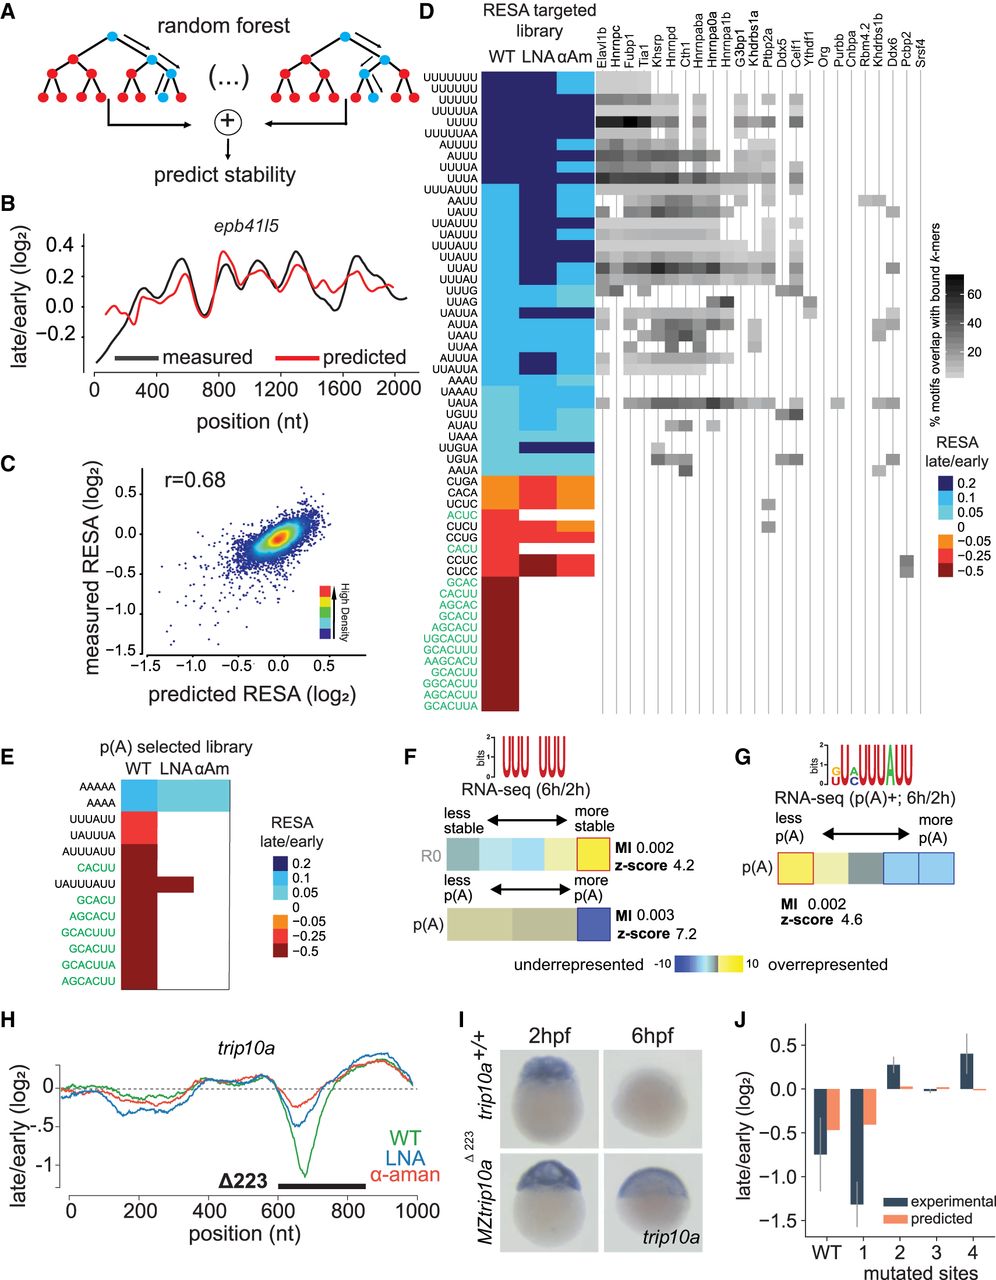
Modeling the effect of sequence on mRNA stability in vivo. (A) Scheme of the procedure for building the random forest model on RESA-targeted profiles. Data generated from window-sliding across the RESA profiles are used to train a random forest model. (B) Example of predicted (red) and RESA-targeted experimental (black) profiles for epb41l5 gene. (C) Model performance per window using fivefold cross-validation; model achieved 0.68 Pearson correlation between predicted stability and measured according to RESA-targeted library. (D, left) Top selected motifs according to the random forest model trained on RESA-targeted library (motifs in green text represent the miR-430 target sites). Columns represent WT, LNA430, and α-amanitin treatment. Color intensity represents the RESA fold-change difference between windows that do or do not contain each motif. Blue represents stabilizing motifs, and red represents destabilizing motifs (all motifs have P below 4.6 × 10−56 (Mann–Whitney U test followed by Bonferroni multiple testing adjustment). (Right) Heatmap representing motif enrichment in the top 50 hexamers enriched in iCLIP experiments. (E) Same as D with random forest model trained on the RESA targeted with poly(A) selection library. (F,G) U-rich (F) and ARE (G) motifs’ enrichment between 2 and 6 hpf within total and/or poly(A) selected RNA-seq. In heatmap, overrepresentation (yellow) and underrepresentation (blue) patterns are shown. Also shown are the mutual information values, Z-scores associated with a randomization-based statistical test, and robustness scores from a threefold jackknifing test. (H) RESA-targeted profile from the trip10a locus. Genetic deletion of a sequence spanning regulated region (black line) results in stabilization of the trip10a transcript as assessed by in situ hybridization (n = 20/20; I). (J) Random forest model validation. Barplot comparing experimental (RNA level by high-throughput sequencing) and predicted average stability of trip10a decay peak and four mutated sites (Spearman's correlation coefficient r = 0.60).


