
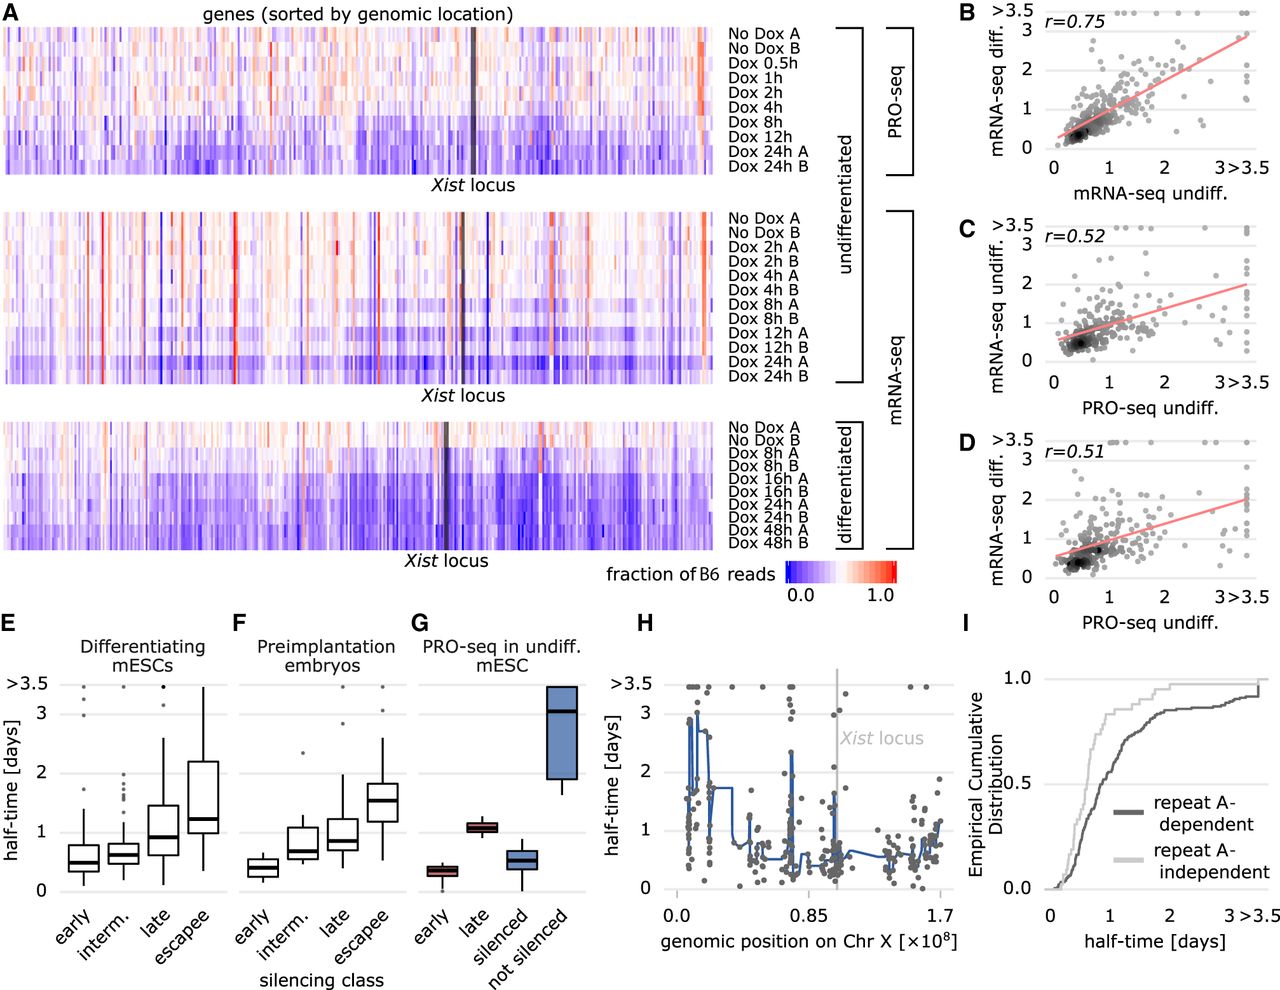
Comparison of PRO-seq-based silencing half-times to other data sets. (A) Comparison of PRO-seq (undifferentiated mESC, upper) and mRNA-seq data (undifferentiated mESCs, middle; differentiated mESCs, lower). Fraction of B6 reads are shown for all genes covered in all three data sets, ordered by genomic position. (B–D) Comparison of estimated half-times (in days) between the data sets shown in A (replicate B only for mRNA-seq undiff.) with fitted regression lines (red). Pearson correlation coefficients are indicated. (E–G) Distribution of half-times within silencing classes defined previously in mESCs (E) (Marks et al. 2015), in preimplantation mouse embryos (F) (Borensztein et al. 2017), and the classes used for Random Forest modeling (G): (blue) XCI/escape model; (red) silencing dynamics model. (H) Estimated half-times (black circles) for all genes in the PRO-seq data set along the X Chromosome. A fitted smooth curve of the half-times is displayed as a blue line, and the Xist locus is marked with a gray line. (I) Cumulative distribution of half-times of genes silenced (independent, light gray) or not silenced (dependent, dark gray) by Xist lacking the repeat A element (Sakata et al. 2017).


