
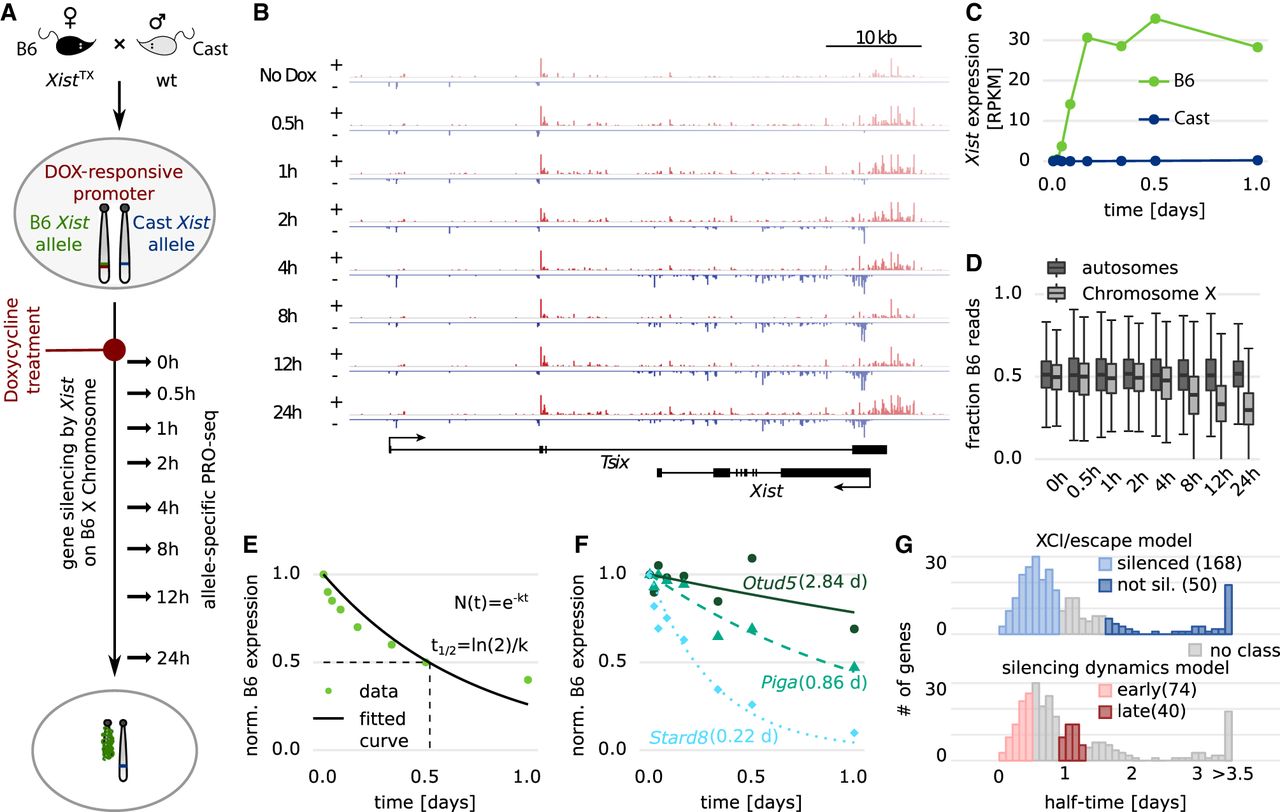
Measuring gene silencing dynamics. (A) Schematic of the experimental setup used in B–F. Using a hybrid female mESC line (B6 × CAST) carrying a Dox-responsive promoter in front of the endogenous Xist gene on the B6 allele, RNAPII activity was measured by allele-specific PRO-seq over a 24-h time course of Dox treatment. (B) Strand-specific read density at the Tsix-Xist locus. Plus-strand is shown in red, minus strand in blue; the y-axis indicates reads per million. (C) Xist expression from the two alleles. (D) Distribution of the fraction of B6 reads for autosomal and X-linked genes over time. (E,F) Schematic (E) and three examples (F) of how gene silencing half-times (in parentheses) were estimated from the allele-specific PRO-seq time course data through fitting an exponential decay function. (G) Distribution of estimated half-times for 280 X-linked genes with an assigned active transcription start site (TSS). The half-time ranges used to define the model classes and the number of genes falling in each category are indicated.


