
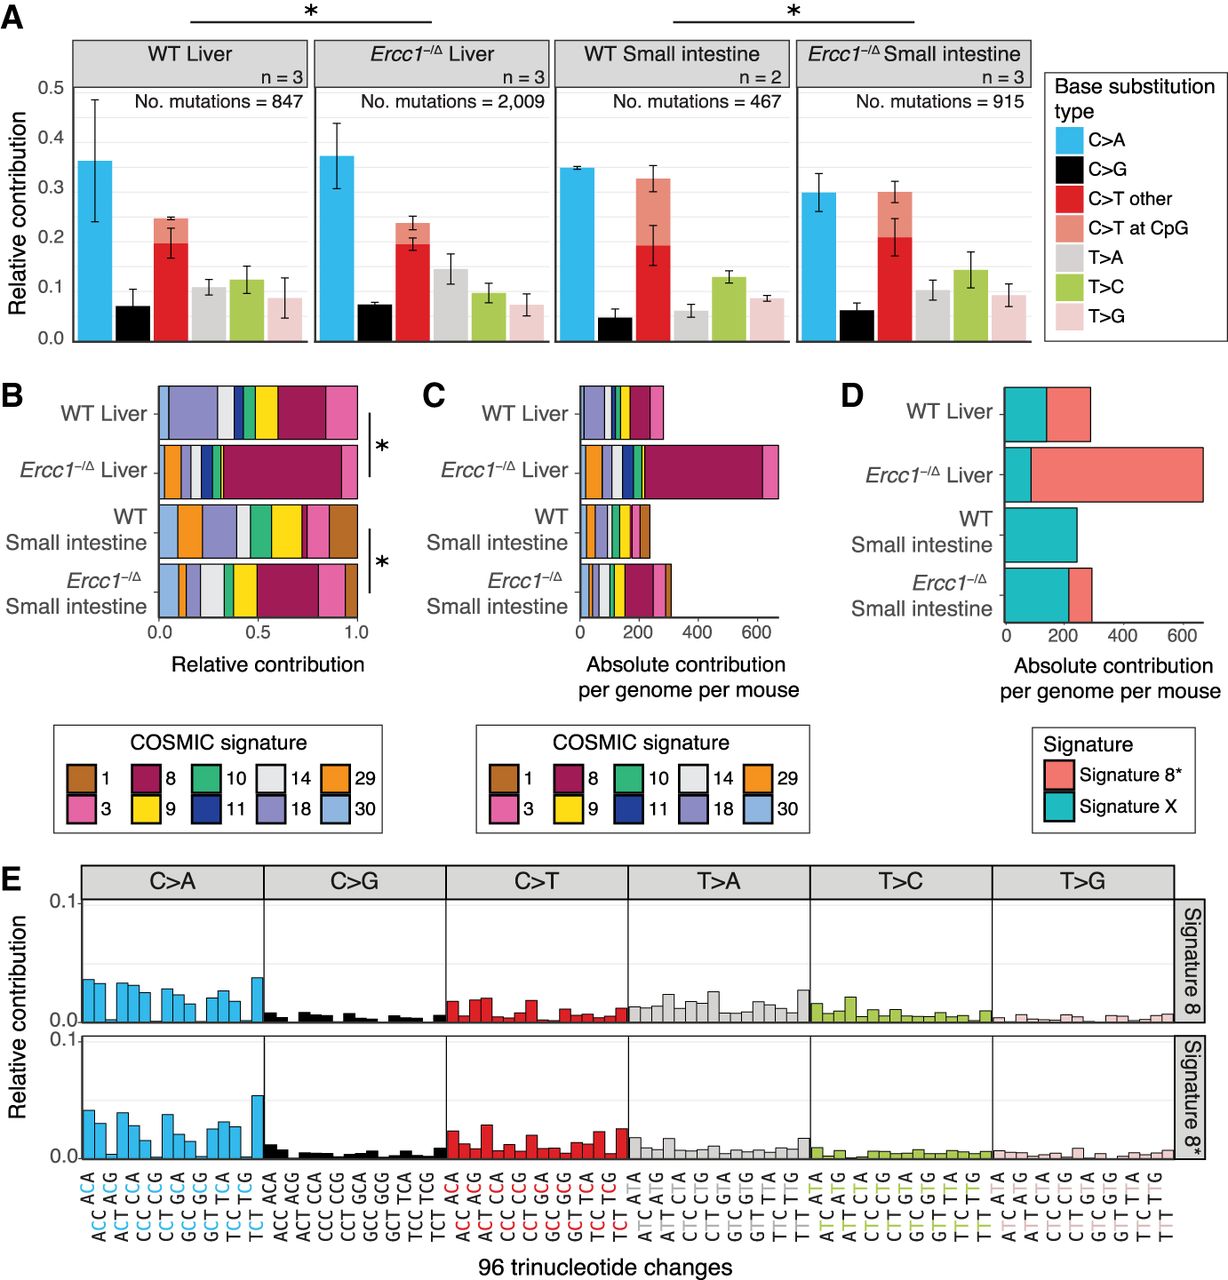
Mutational patterns of base substitutions acquired in the genomes of ASCs from liver and small intestine of WT and Ercc1−/Δ mice. (A) Mean relative contribution of the indicated mutation types to the mutation spectrum for each mouse ASC group. Error bars represent standard deviations. The total number of mutations and total number of ASCs (n) per group is indicated. Asterisks indicate significant differences in mutation spectra (q < 0.05, χ2 test, FDR correction). (B) Relative contribution of the indicated COSMIC mutational signatures to the average 96-channel mutational profiles of each mouse ASC group. Asterisks indicate significantly different signature contributions; P-values were obtained using a bootstrap resampling approach (Methods; Supplemental Fig. S6E,F). (C) Absolute contribution of the indicated COSMIC mutational signatures to the average 96-channel mutational profiles of each mouse ASC group. (D) Absolute contribution of two mutational signatures that were identified by nonnegative matrix factorization (NMF) analysis of the average 96-channel mutational profiles of each mouse ASC group. (E) Relative contribution of each indicated context-dependent base substitution type to mutational Signature 8 and Signature 8*.


