
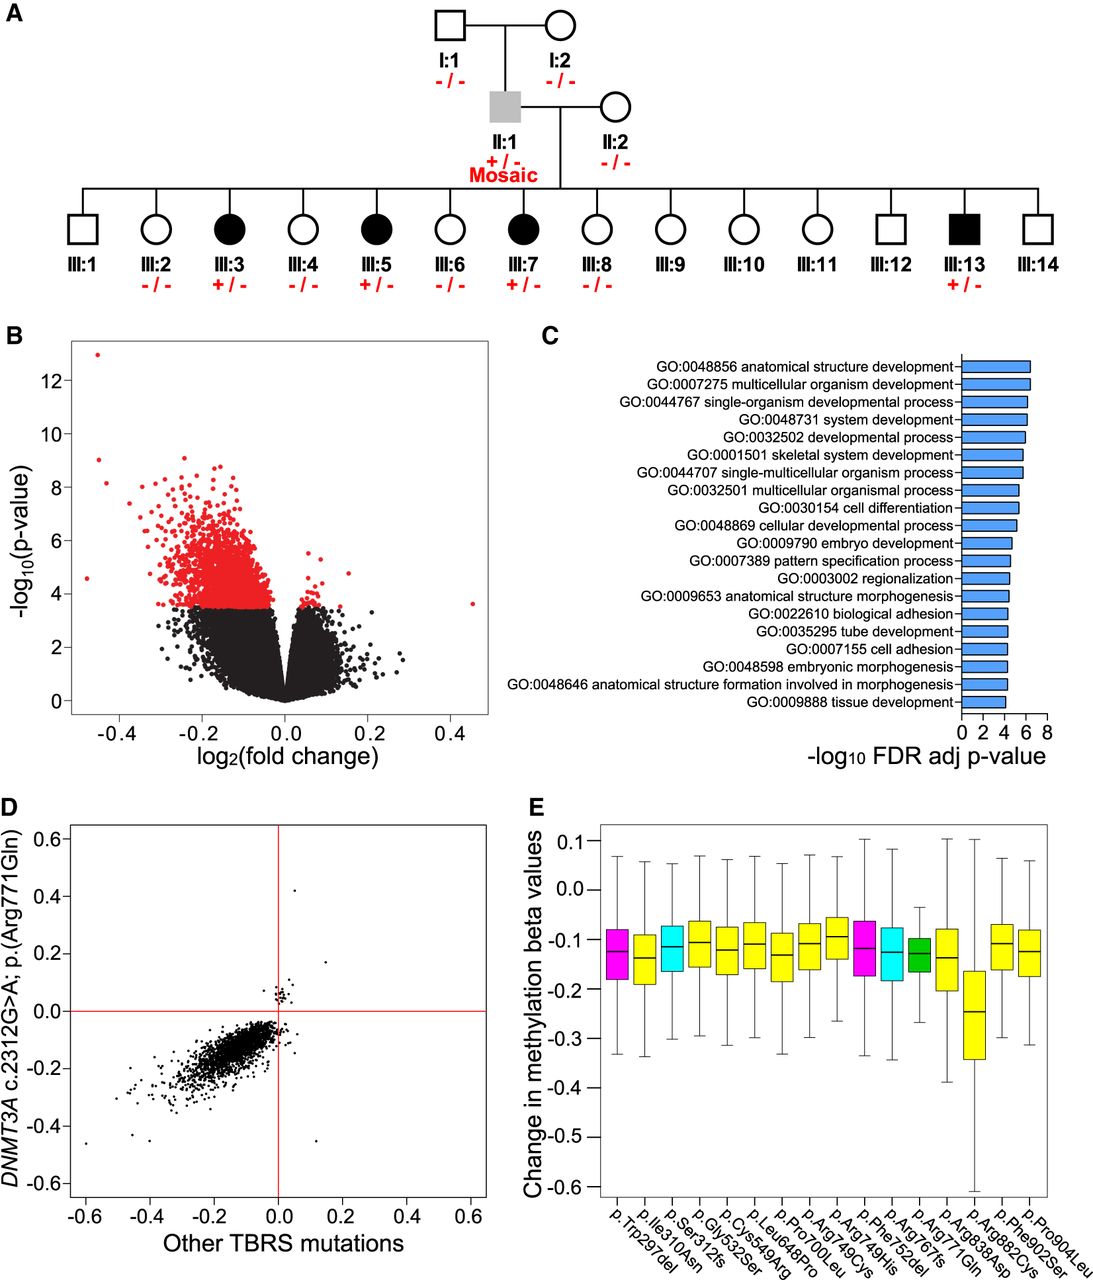
TBRS DNMT3A variants are associated with widespread DNA hypomethylation. (A) Simplified pedigree indicating the genotyping of individuals in the Amish family investigated: (+/−) heterozygous carriers of the DNMT3A c.2312G > A p.(Arg771Gln) variant; (+/− Mosaic) the DNMT3A c.2312G > A p.(Arg771Gln) mosaic father; (−/−) wild-type individuals. Black shading indicates individuals with a phenotype consistent with TBRS, gray shading, the father with macrocephaly and mild intellectual impairment; and white shading, unaffected individuals. Each of these samples was profiled on the Illumina 450K DNA methylation array. (B) Volcano plot showing site-specific DNA methylation differences (x-axis) and −log10 P-values (y-axis) from an analysis comparing Amish DNMT3A c.2312G > A; p.(Arg771Gln) pathogenic variant carriers and wild-type family members using the Illumina 450K array. Red values indicate the 2606 differentially methylated positions (DMPs) detected at a Benjamini–Hochberg FDR < 0.05. (C) Top 20 Gene Ontology enrichment analysis categories associated with the 2606 DMPs identified in DNMT3A c.2312G > A; p.(Arg771Gln) pathogenic variant carriers versus wild-type family members. (D) Comparison of DNMT3A c.2312G > A; p.(Arg771Gln) identified DMPs (log2 fold change) relative to other DNMT3A TBRS-associated variants assessed in this study (all variants grouped and measured relative to controls). Pearson correlation coefficient = 0.6620, P-value <2.2 × 10⁻¹⁶. (E) Boxplot illustrating the DNA methylation changes observed in association with the DNMT3A TBRS variants studied at the DMPs identified in the Amish DNMT3A c.2312G > A p.(Arg771Gln) carriers. The predicted protein consequence of each DNMT3A variant studied is indicated: Pink indicates in-frame deletion; yellow, single-nucleotide variant; cyan, duplications predicted to result in a frameshift; green, Amish c.2312G > A; p.(Arg771Gln) variant.


