
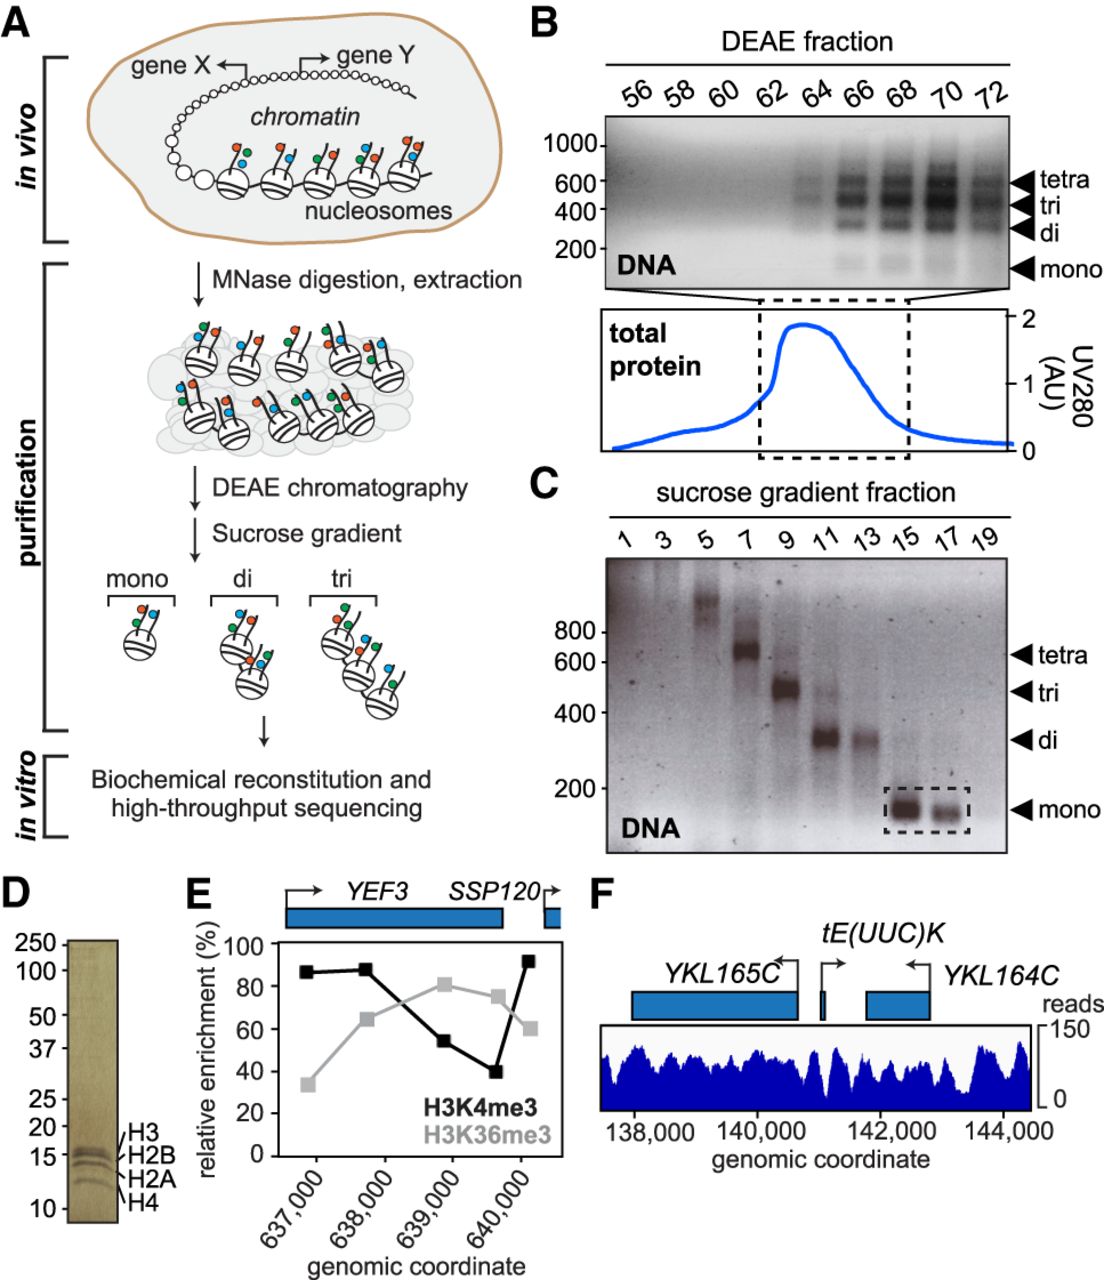
Purification and characterization of genomic chromatin. (A) Schematic of experimental approach. Colored circles, histone marks. (B) DNA from DEAE fractions analyzed by agarose gel electrophoresis (top panel); marker on left shows length in bp. Bottom panel, chromatogram of total eluted protein. Fractions 66–72 were loaded on the sucrose gradient. (C) DNA from sucrose gradient analyzed by agarose gel electrophoresis. Fractions used for experiments are indicated by stippled box. (D) Silver-staining of purified mononucleosomes from C. (E) Histone mark patterns of purified mononucleosomes as determined by native ChIP-qPCR. Histone marks were normalized to histone H3, as in the reference data sets of Pokholok et al. (2005) and Kim and Buratowski (2009). (F) Representative map of nucleosomes on Chromosome XI after paired-end sequencing and alignment to the yeast genome.


