
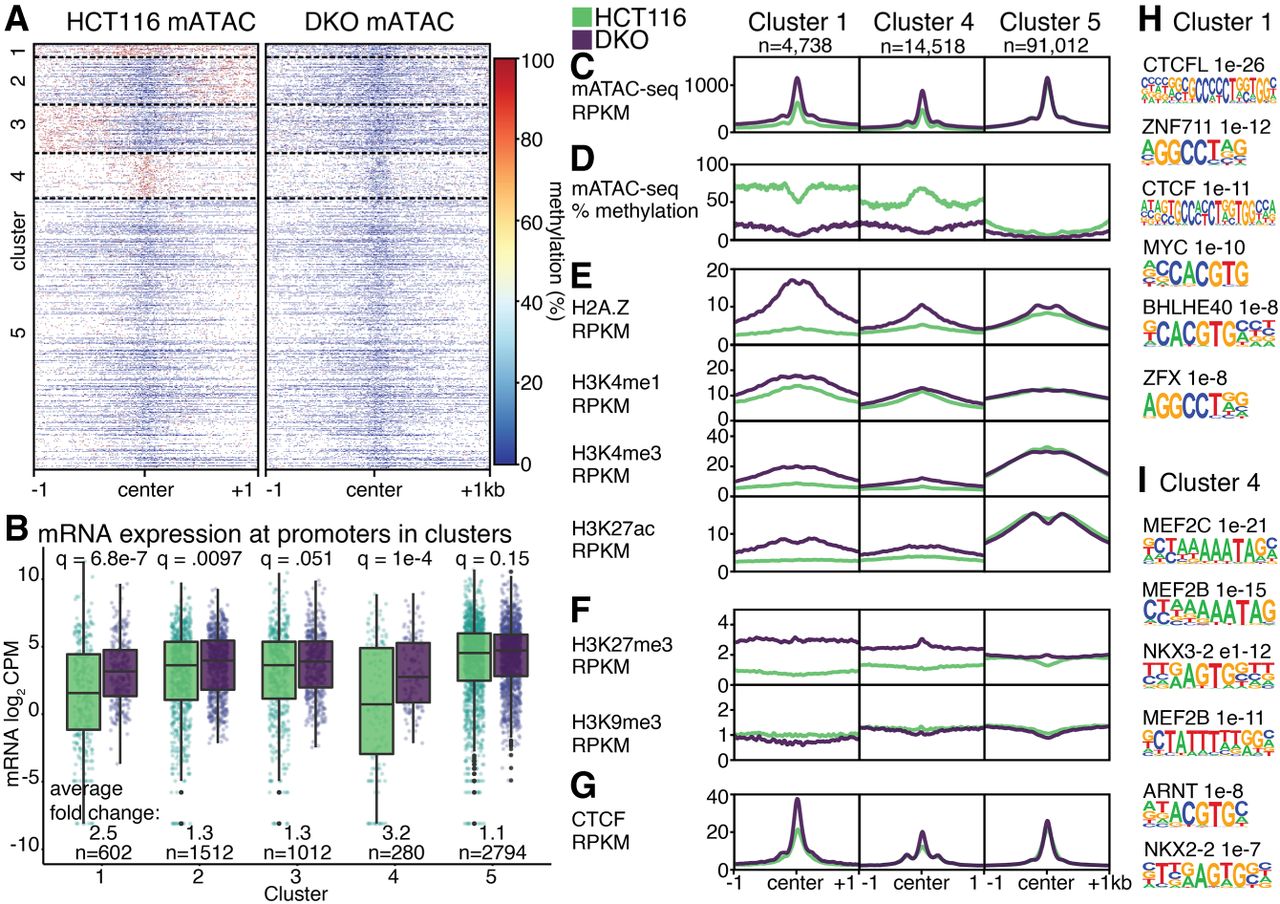
Figure 4.
Combined accessibility and methylation analysis. (A) DNA methylation at mATAC-seq peaks from HCT116 and DKO cells form five distinct clusters by DNA methylation. (B) mRNA expression in log2 CPM at identified clusters. Features in Clusters 1, 4, and 5 are depicted according to accessibility (C), DNA methylation (D), activating histone modifications (E), silencing histone modifications (F), and CTCF (G). Motifs enriched in Cluster 1 (H) and Cluster 4 (I), compared to Cluster 5. Q-values are for Wilcoxon tests with Benjamini–Hochberg correction.


