
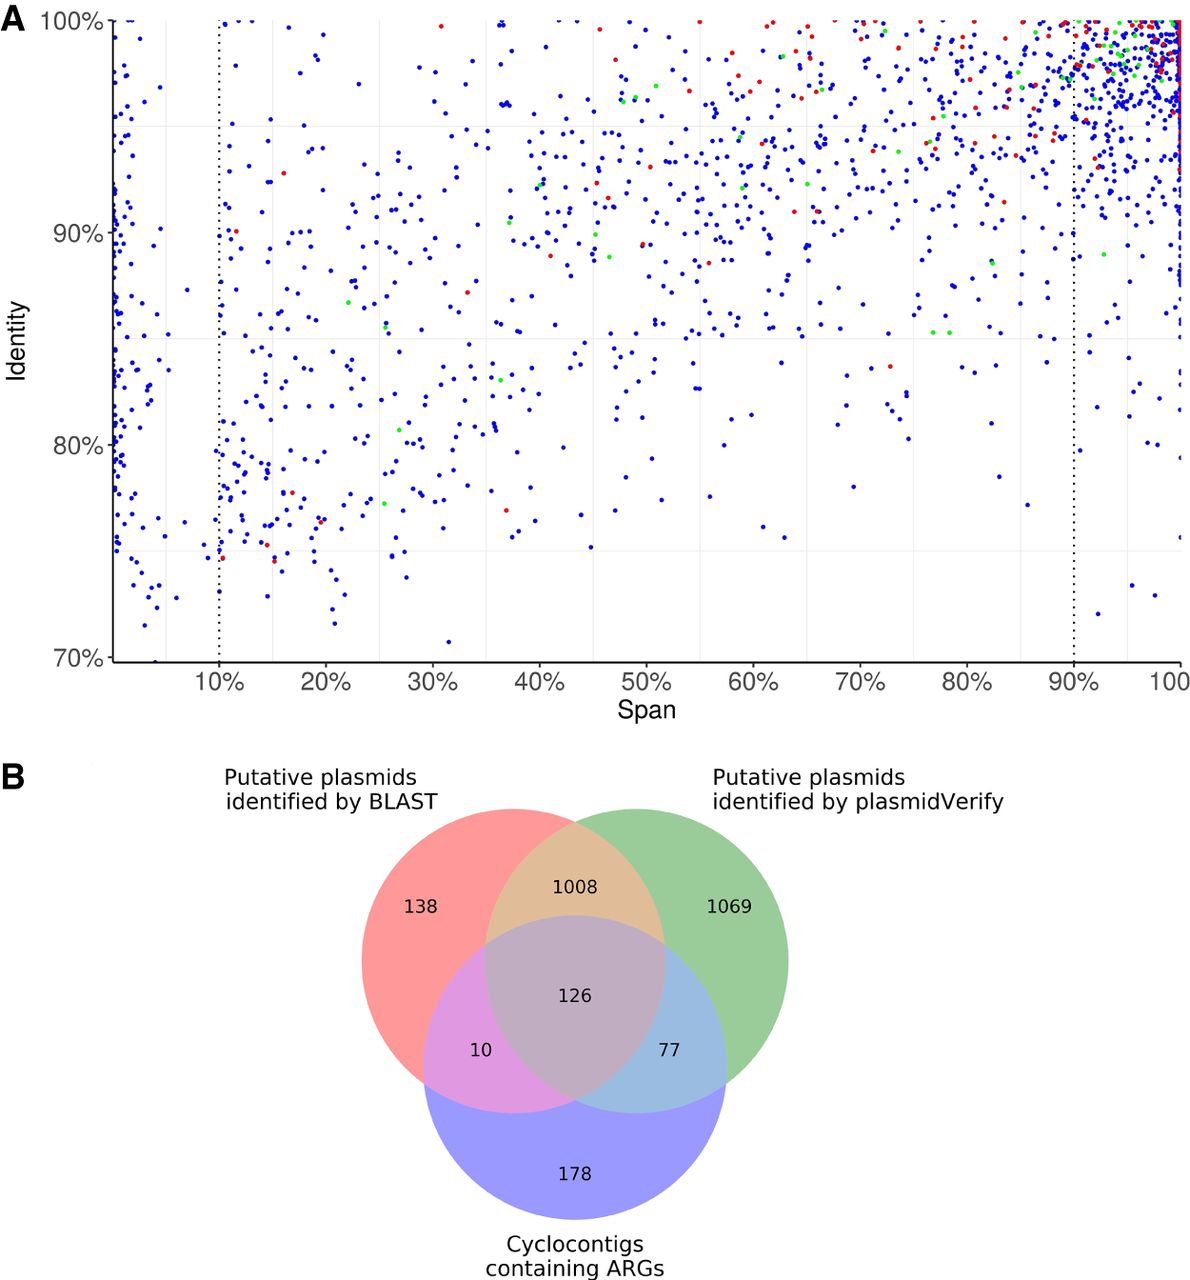
The scatter plot of the span and identity for all 2280 unique cyclocontigs in the ISOLATES data set reconstructed by plasmidSPAdes+ (A) and the Venn diagram for cyclocontigs identified as plasmids by plasmidVerify, cyclocontigs identified as plasmids by BLAST (span >10%), and cyclocontigs containing ARGs (B). (A) Each dot represents a cyclocontig reported by plasmidSPAdes and verified by plasmidVerify. Red dots represent cyclocontigs containing antibiotic-resistance genes (ARGs). Green dots represent cyclocontigs classified as viral sequences. (B) The Venn diagram illustrates that the HMM-based approach in metaplasmidSPAdes identifies many plasmids with important phenotypes that are missed by a straightforward BLAST-based approach.


