
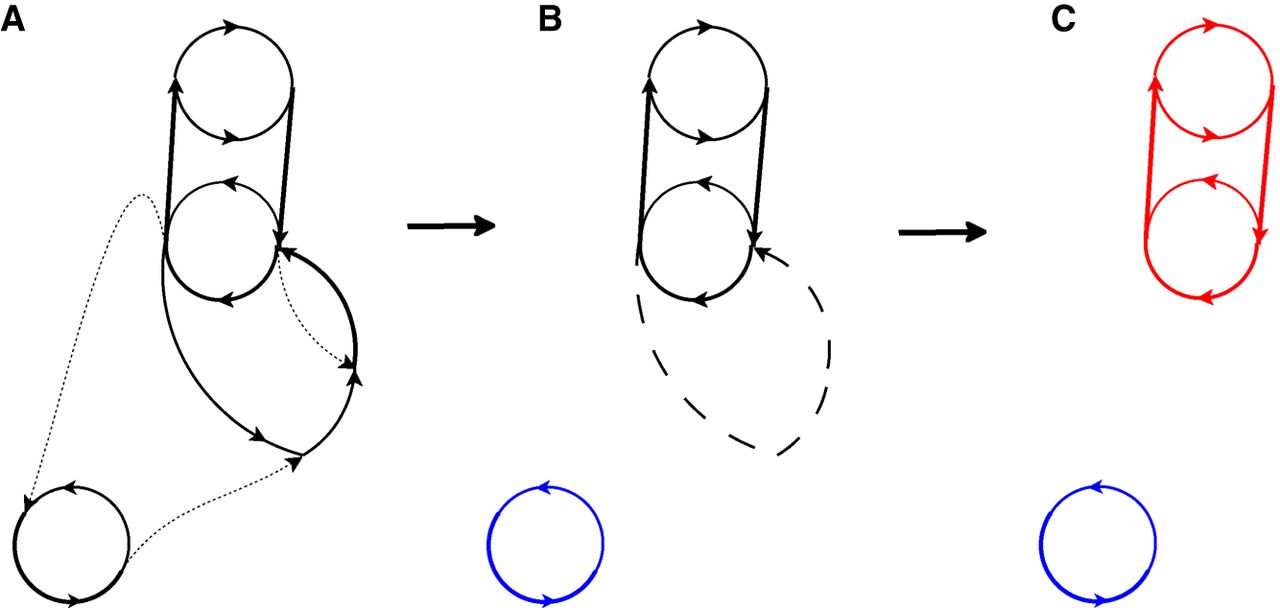
Figure 1.
Iterative plasmid detection in the assembly graph. (A) The assembly graph Graph with three dotted edges representing edges with the lowest coverage. (B) Removal of three edges with the lowest coverage from Graph reveals a plasmid (cyclocontig) shown in blue. The three edges on the graph in A now represent a single dashed edge that has the lowest coverage in Graph. (C) The same graph after the second iteration of metaplasmidSPAdes that removes the dashed edge with the lowest coverage and reveals a plasmid (connected component) shown in red.


