
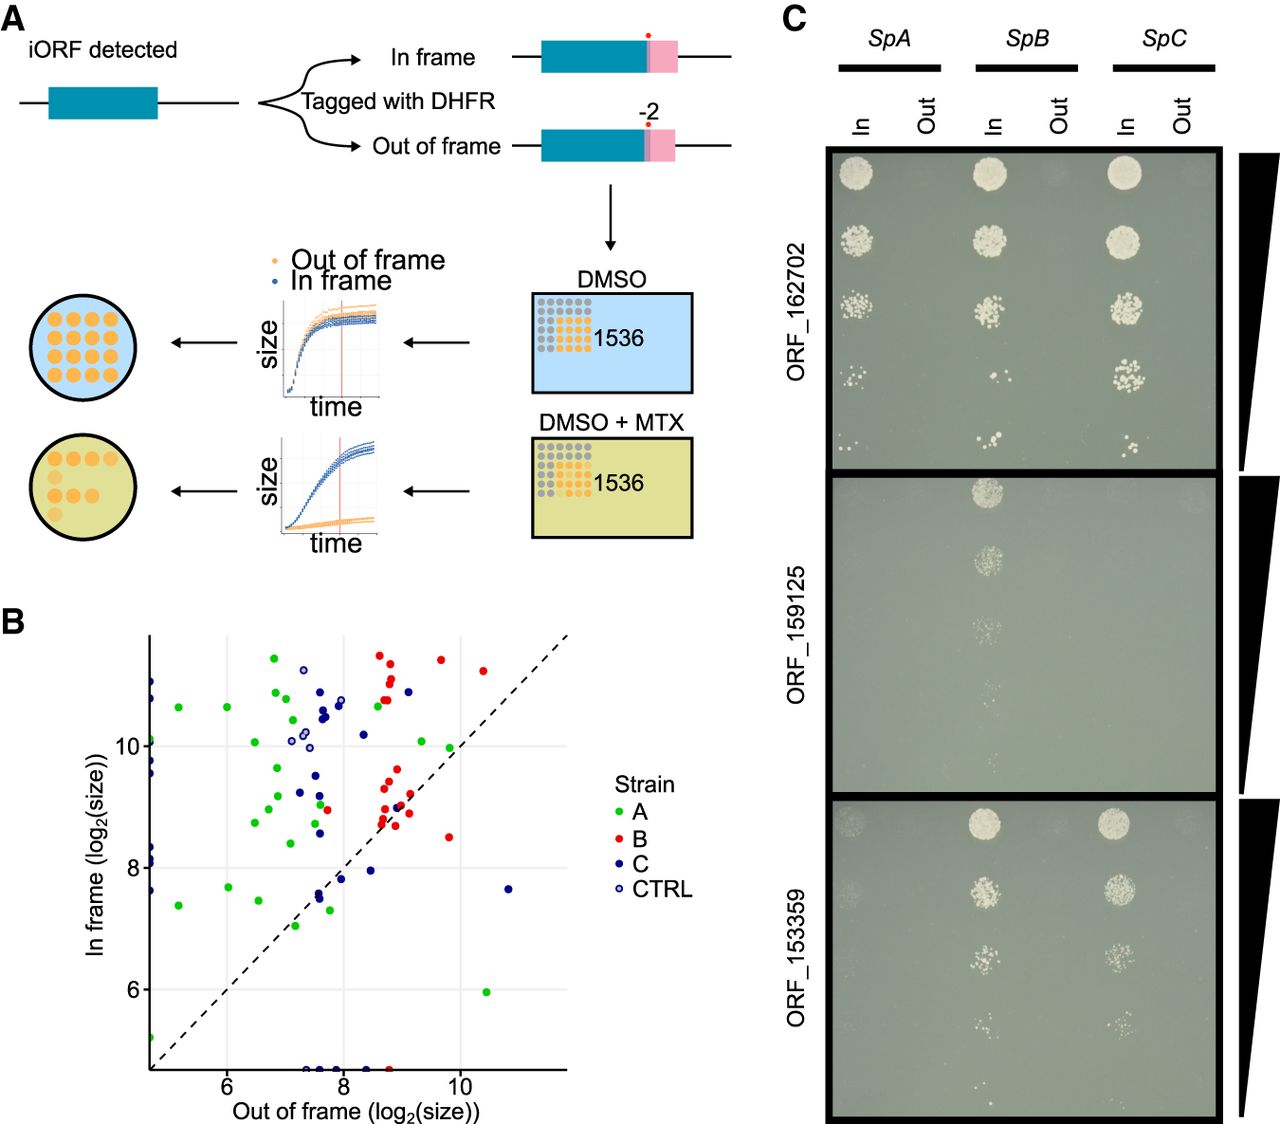
DHFR tagging confirms expression of tORFs. (A) Conceptual figure of the approach. Forty-five tORFs were tagged with a full-length Dhfr—in-frame or out-of-frame in SpA, SpB, and SpC—and then phenotyped by time-resolved imaging and spot-dilution assays. (B) Log2 colony sizes of strains tagged with Dhfr in-frame (y-axis) or out-of-frame (x-axis). The colony size is measured after ∼60 h of growth (shown as a red vertical line in panel A) on medium supplemented with methotrexate. Colors represent the different strains. Canonical genes are tagged in the CTRL strains (SpC strain). Dashed line indicates y = x. (C) Spot-dilution assays further confirm expression of the tORFs and show differential expression of tORF_153359, tORF_159125, and tORF_162702. Fivefold dilutions go from top to bottom. For the corresponding controls in medium not supplemented with methotrexate, see Supplemental Figure S9.


