
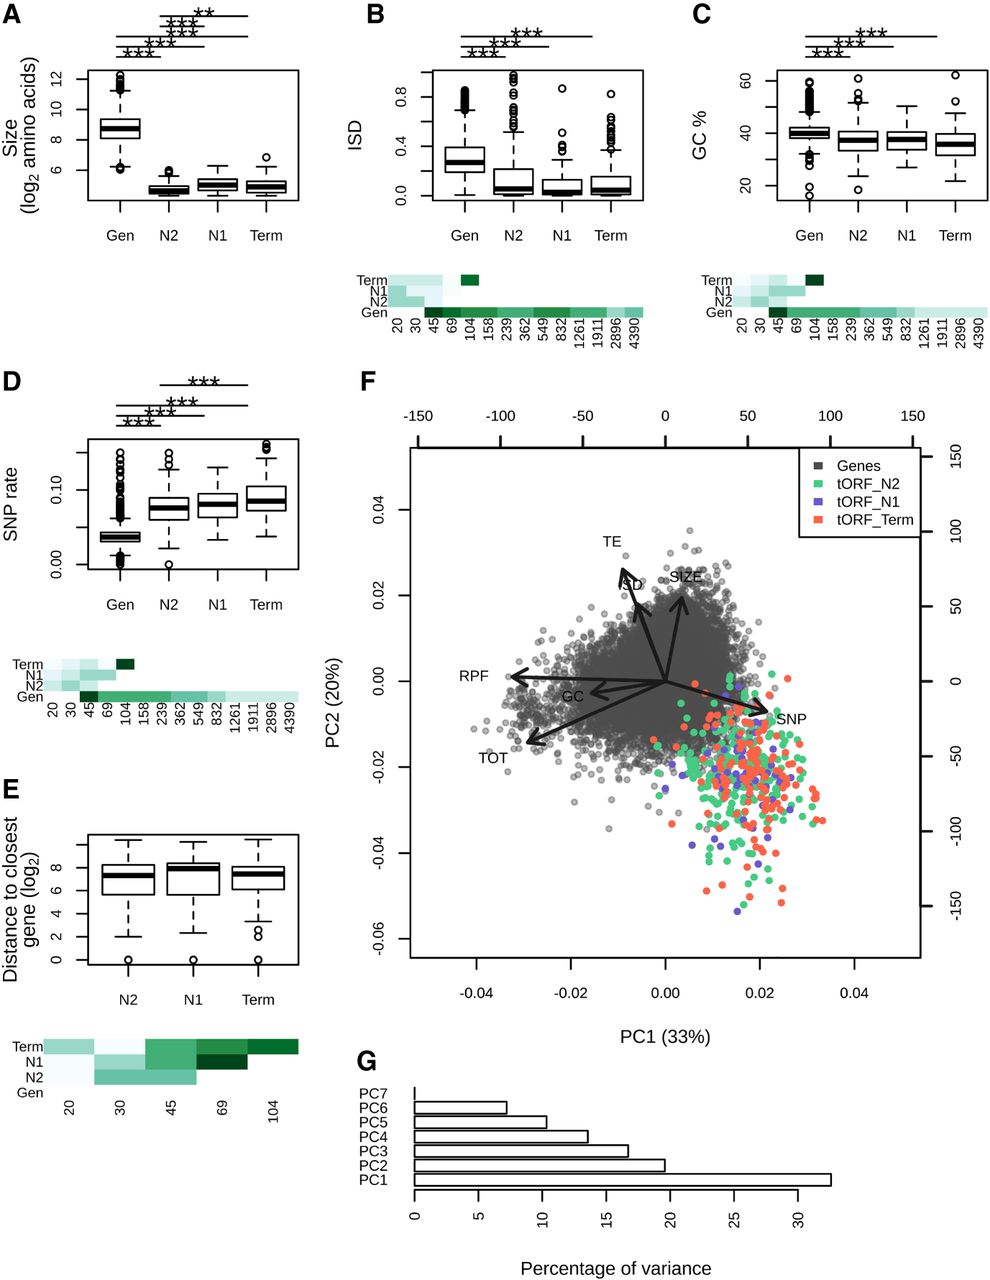
Age-dependent characteristics of intergenic polypeptides. (A–E) Sizes (log2 number of residues), mean disorder (ISD), GC%, SNP density, and distance to the closest gene are displayed for genes and tORFs as a function of their age (N2, N1, and Term). Pairwise significant differences are displayed above each plot: Wilcoxon test; (***) P-values <0.001, (**) P-values <0.01, and (*) P-values <0.05. Mean estimates per size range are colored in shades of green (from pale for low values to dark green high values). (F) Principal component analysis using the number of residues (SIZE in log2), ribosome profiling (RPF), total RNA (TOT) and TE (as read counts in the first 60 nt normalized to correct for library size differences and in log2), intrinsic disorder (ISD), the GC%, and SNP density (SNP). tORFs are colored as a function of their age. (G) Percentage of variance explained by each PCA axis (the two first axes explain 33% and 20% of the variation for a total of 53%).


