
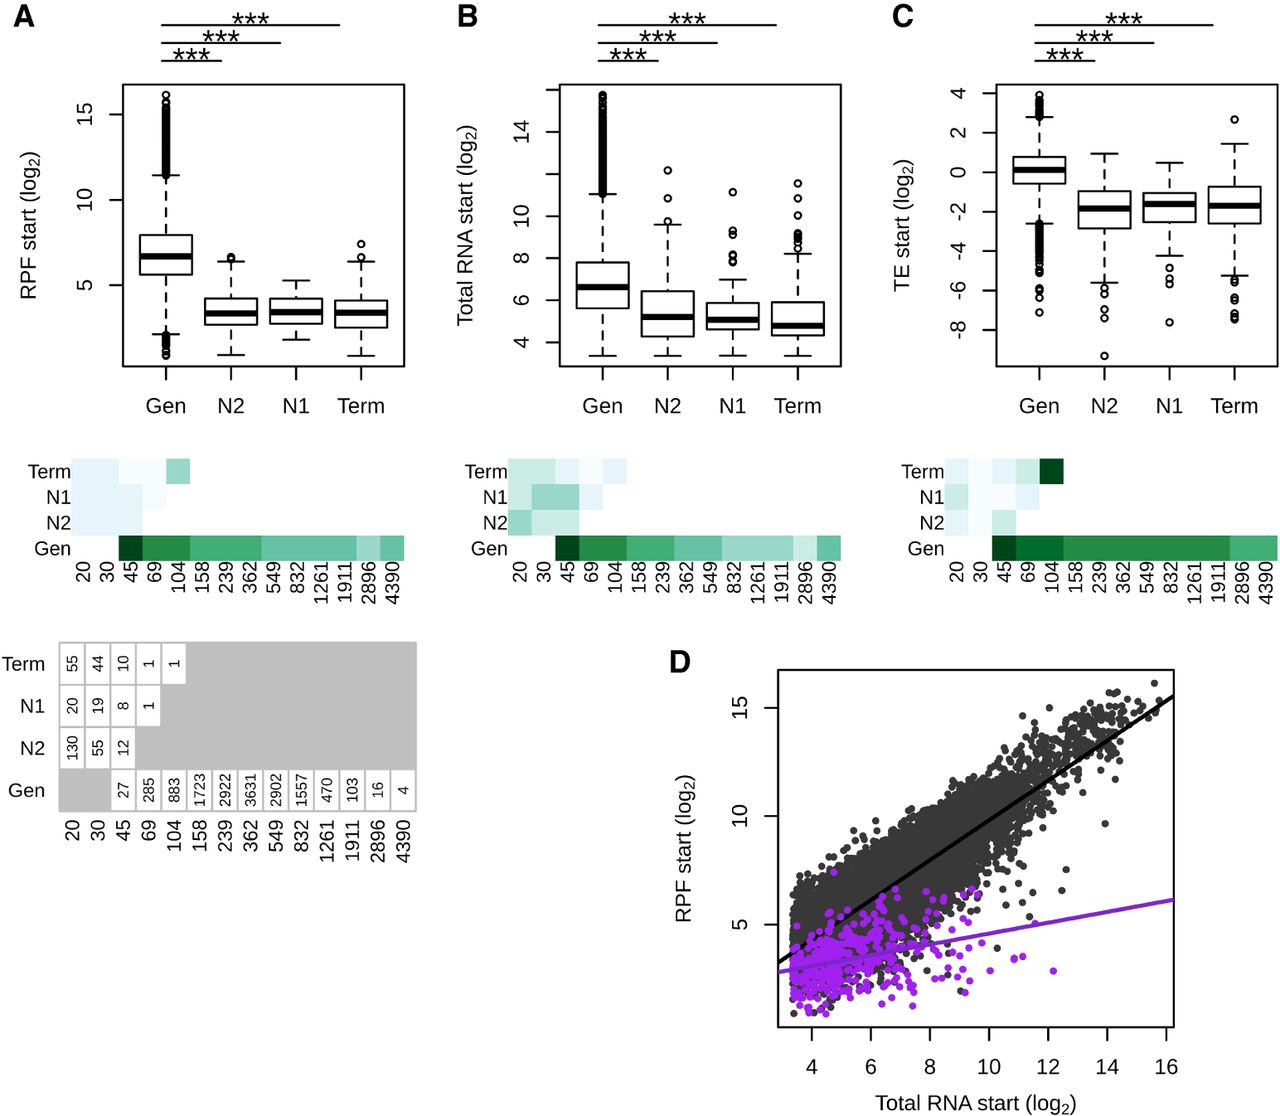
Putative intergenic polypeptides are less efficiently translated compared with genes. (A–C) Ribosome profiling (RPF start), total RNA (Total RNA start), and translation efficiency (TE start)—read counts in the first 60 nt, normalized to correct for library size differences in log2—are displayed for genes (Gen) and tORFs depending on their ages (N2, N1, and Term). Significant differences in pairwise comparisons are displayed above each plot: Wilcoxon test; (***) P-values <0.001, (**) P-values <0.01, and (*) P-values <0.05. Mean estimates per size range are colored in shades of green (from pale for low values to dark green for high values). tORF and gene numbers per size range and age are indicated below the graph. (D) RPF plotted as a function of total RNA for tORFs in purple or for genes in gray. Regression lines are plotted for significant Spearman correlations (P-values <0.05). Expression levels were calculated using the mean of the two replicates.


