
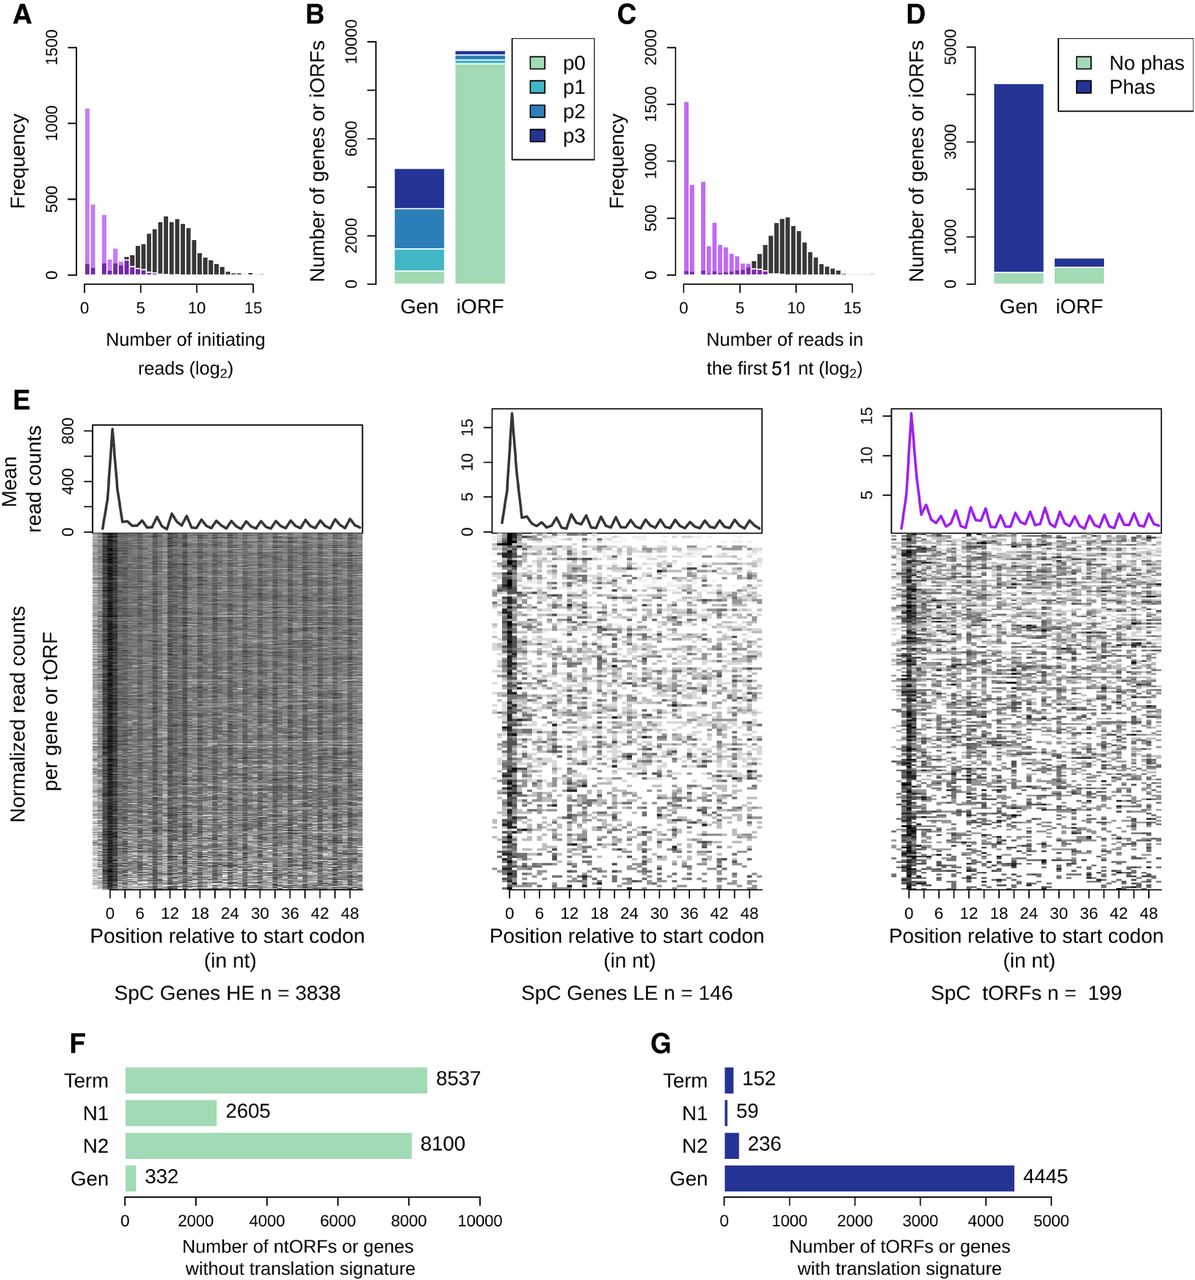
A fraction of the iORFs display translation signatures similar to genes. (A) Distribution of the ribosome profiling read counts for genes (gray) and iORFs (purple) at the start codon position. (B) Number of genes (Gen) or iORFs with a detected initiation peak at the start codon position. Peaks are colored according to the precision of the detection (see Methods), from the most precise (p3) to the least precise (p1). Genes and iORFs with no peaks detected are shown in green (p0). (C) Distribution of the ribosome profiling read counts in the first 51 nt of iORFs, excluding the start codon. (D) Proportions of genes or iORFs with a significant in-frame codon periodicity (read phasing in blue) among genes and iORFs with a detected initiation peak. Genes and iORFs with no detected phasing are shown in green. (E) Metagene analysis for significantly high (HE; left) or low (LE; middle) translated genes (gray) and for intergenic tORFs (purple; right). The mean of the 5′ read counts is plotted along the position relative to the start codon for significantly translated genes or tORFs. The lines of the matrix indicate the normalized coverage of genes or tORFs with significant translation signatures, with one feature per line. (A–E) Results for the SpC strain MSH587-1 are shown (for SpA and SpB results, see Supplemental Fig. S3). (F,G) Number of genes or iORFs without (ntORFs; F) or with (tORFs; G) translation signatures detected in at least one of the four strains. Actual numbers are indicated next to each bar. iORFs are classified according to their age (N2, N1, or Term; see Methods) (Fig. 1; Table 1).


