
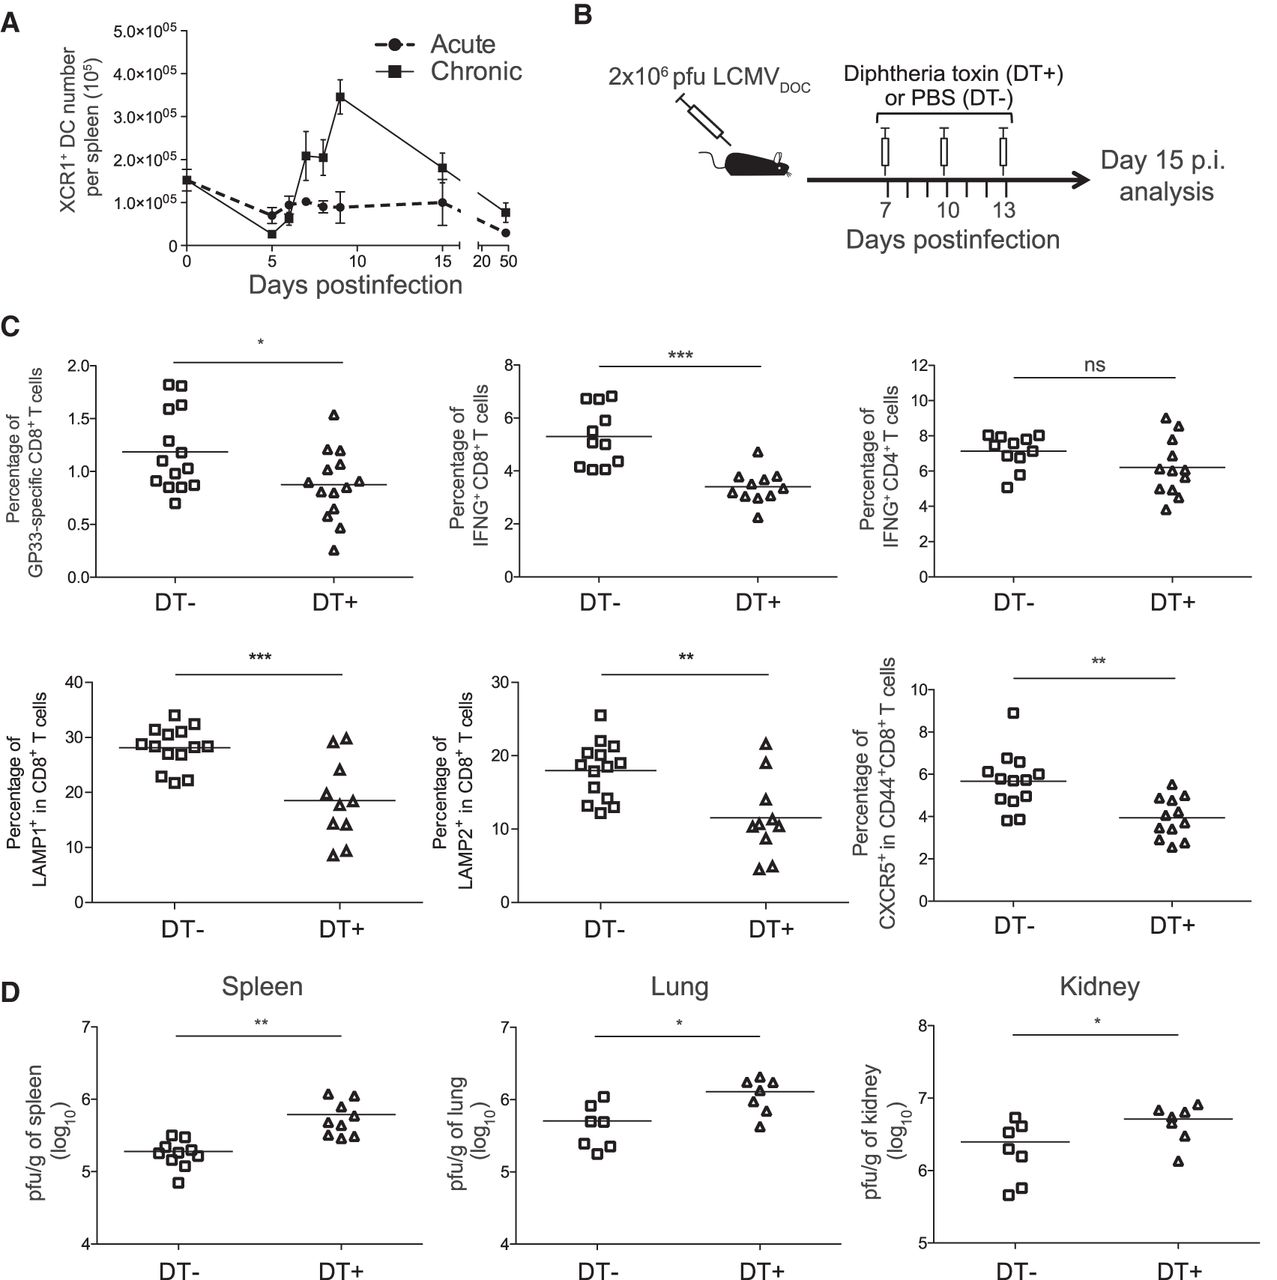
XCR1+ dendritic cells maintain antiviral T cell responses and control virus titers. (A) Number of XCR1+ dendritic cells in spleen. (B) Schematic representation of DT treatment regimen for depletion of XCR1+ dendritic cells. (C) Percentages of DbGP33-41+ CD8+ T cells, IFNG-producing CD8+ and CD4+ T cells, LAMP1+ and LAMP2+ CD8+ T cells, and CXCR5+ CD44+ CD8+ T cells at day 15 PI from chronic infected mice nontreated (DT−) or treated (DT+) with DT. (D) Virus titers in spleen, lung, and kidney at day 15 PI from chronic infected mice nontreated (DT−) or treated (DT+) with DT. (C,D) The mean ± SEM is shown. (ns) nonsignificant; (*) P ≤ 0.05; (**) P ≤ 0.001; (***) P ≤ 0.0001 unpaired two-tailed t-test. Data are representative of two or three independent experiments.


