
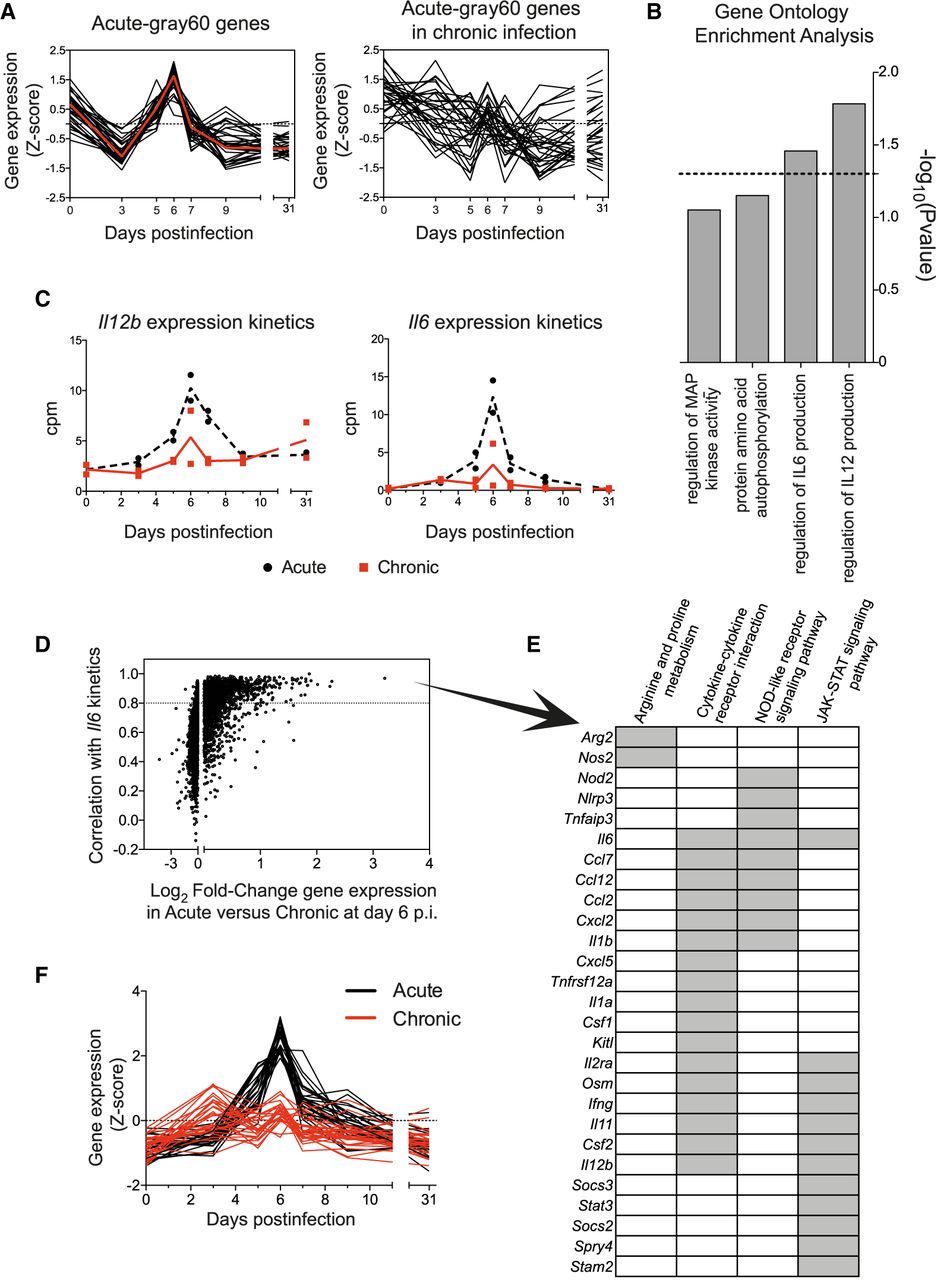
Acute-gray60-specific module unveils a differential regulation of genes related to macrophage inflammatory responses in acute and chronic infections. (A) Normalized expression kinetics of genes from the acute-gray60 module and their corresponding kinetics in chronic infection. Red line represents the kinetics of the eigengene. (B) GO terms enriched in genes from the acute-gray60 module (dashed line mark P = 0.05). (C) RNA-seq-derived Il12b and Il6 expression kinetics in acute and chronic infections. (D) Pearson's correlation between genes of the acute-blue module and Il6 in acute infection is plotted against the log2 fold-change (log2FC) of gene expression between acute and chronic infection at day 6 PI. Dashed line marks a correlation >0.8. (E) List of 27 representative genes with a correlation > 0.8 with Il6 expression kinetics. Gray boxes indicate enriched KEGG pathways to which each gene belongs. (F) Normalized expression kinetics of the 27 genes shown in E.


