
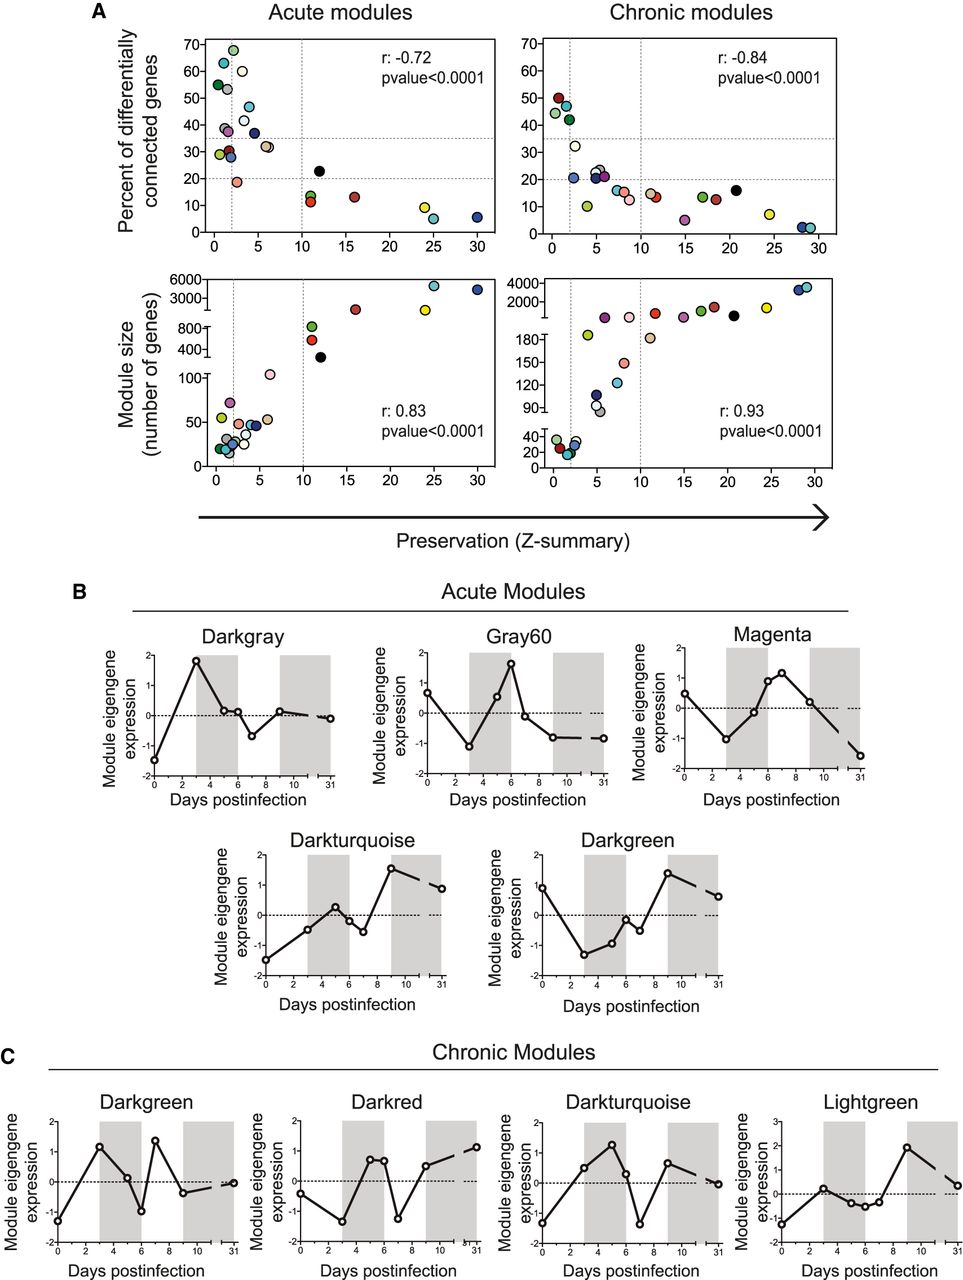
Figure 3.
Module preservation between acute and chronic infections. (A) Module preservation scores were compared to the percentage of differentially connected genes in a module and to module size. Dashed lines indicate the thresholds (Methods). The Spearman's rank correlation coefficients (r) and the P-values are indicated. (B,C) Eigengene expression profiles of acute- (B) and chronic-specific (C) modules.


