
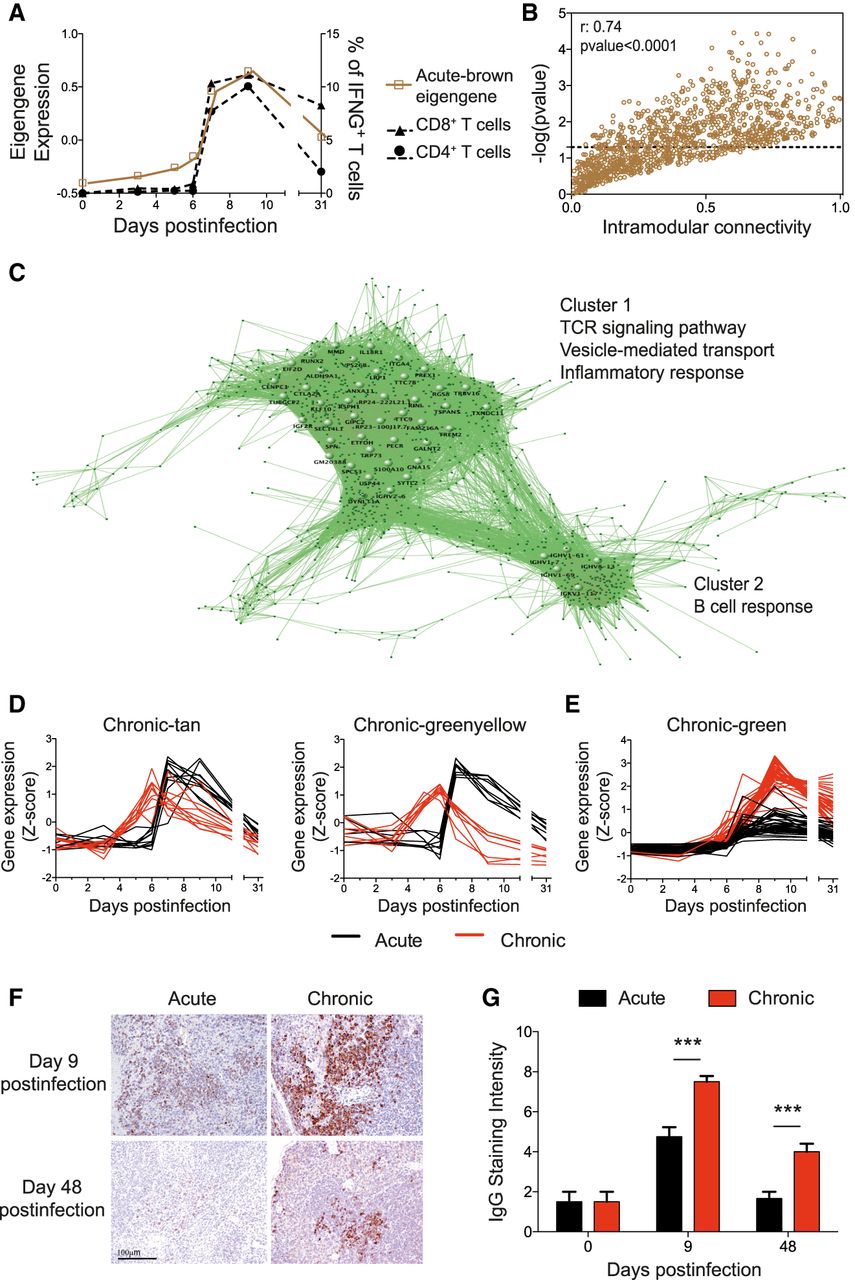
Genes related to T and B cell responses from the acute-brown module are disassociated in chronic infection. (A) Acute-brown module eigengene and kinetics of GP33-specific CD8+ and GP61-specific CD4+ T cells. (B) Intramodular connectivity versus GP33-specific CD8+ T cell kinetics correlation significance for acute-brown module genes. (C) Visualization of the acute-brown module genes. Large nodes represent hub genes with high connection densities (TOM > 0.5). (D,E) Expression kinetics of acute-brown module genes related to T cell activation (D) and hub genes related to the B cell response (E) in acute and chronic infections. (F) Representative images of IgG immunohistochemical staining of spleens. Magnification bar: 100 µm. (G) Semiquantification of IgG-positive cells in spleens (score 0–10). Data shown are mean ± SEM of four mice per group and time point. (***) P ≤ 0.001 unpaired two-tailed t-test.


