
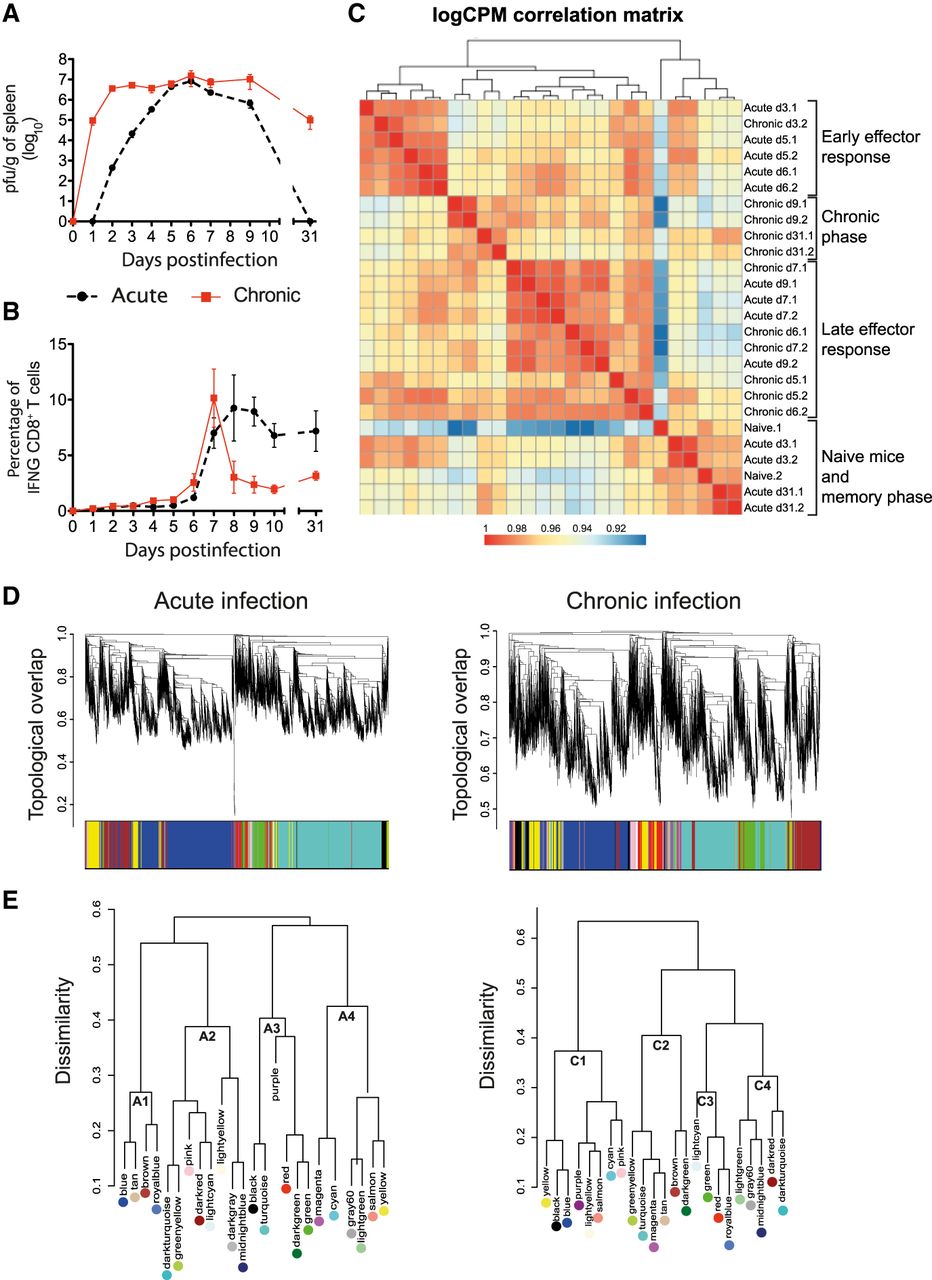
Kinetics of virus expansion, CD8+ T cell response, and transcriptome analysis in acute and chronic LCMV infections. Virus titers (A) and percentages of GP33-specific IFNG-producing CD8+ T cells (B) in spleen. The mean ± SEM is shown. (C) Correlation matrix heatmap of gene expression across acute and chronic infection samples. The color scale indicates the degree of correlation. (D) Hierarchical clustering dendrogram for all differentially expressed genes (lines) obtained by WGCNA. The branches correspond to modules of highly coexpressed groups of genes. Colors below the dendrogram indicate the module to which each gene was assigned. (E) Hierarchical clustering dendrogram of dissimilarity based on module eigengenes.


