
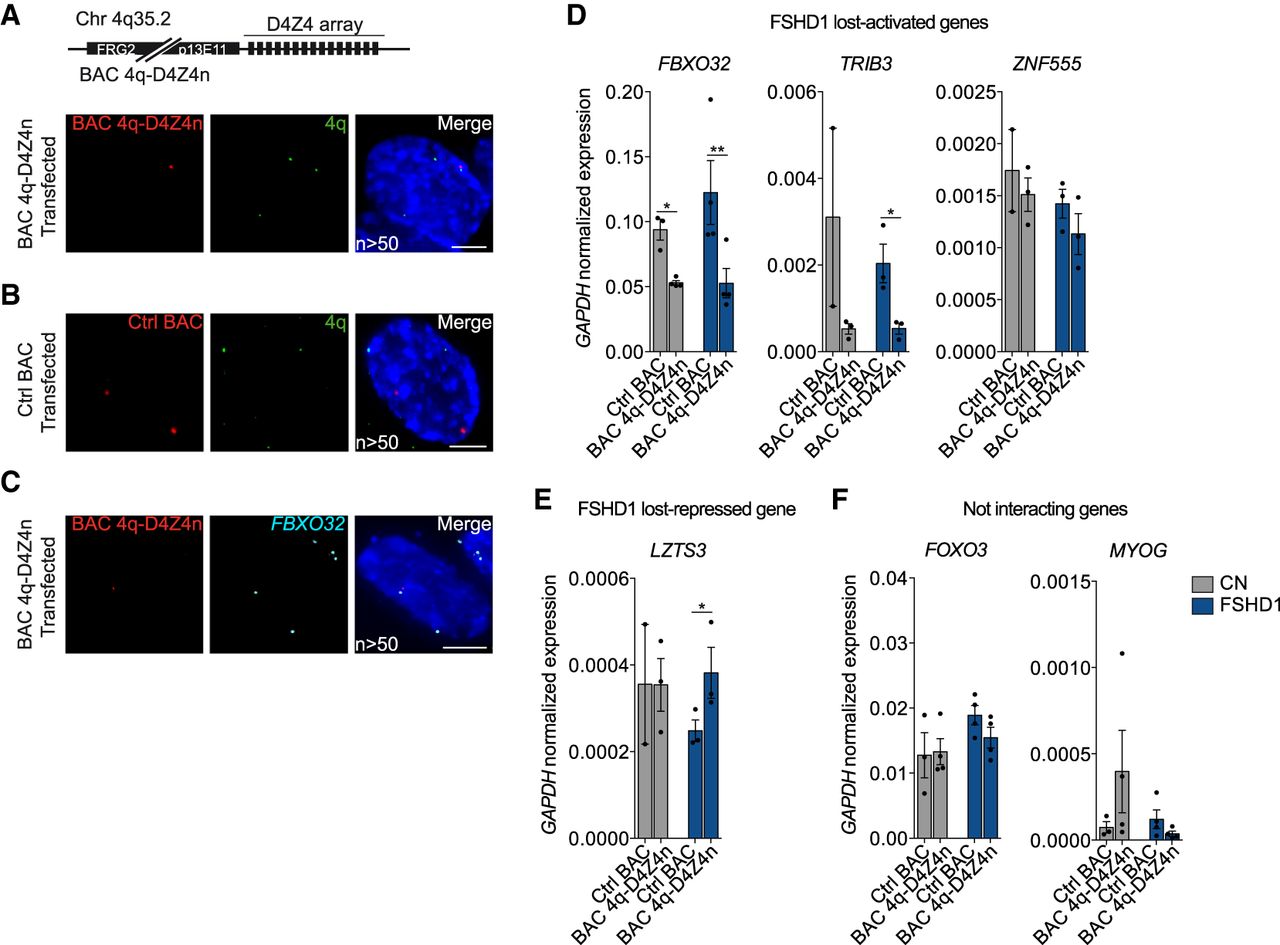
Ectopic 4q-D4Z4 array restores the expression of FSHD1-lost interacting genes. (A, top) Representation of the BAC containing a 4q upstream region and wild-type D4Z4 (BAC 4q-D4Z4n) (see Methods). (Bottom) Representative nucleus of 3D multicolor DNA FISH using probes for the transfected BAC backbone (red) and 4q35.1 region (4q; green) in MBs transfected with BAC 4q-D4Z4n. Nuclei are counterstained with DAPI (blue). All images are at 63× magnification. Scale bar, 5 µm. (n) Number of nuclei analyzed. (B) Representative nucleus of 3D multicolor DNA FISH using probes for the transfected BAC backbone (red) and 4q35.1 region (4q; green) in MBs transfected with Ctrl BAC (RP11-2A16, representative of an unrelated and not interacting genomic region, Chr 17q21.33). Nuclei are counterstained with DAPI (blue). All images are at 63× magnification. Scale bar, 5 µm. (n) Number of nuclei analyzed. (C) Representative nucleus of 3D multicolor DNA FISH using probes for the transfected BAC backbone (red) and FBXO32 region (FBXO32; light blue) in MBs transfected with BAC 4q-D4Z4n. Nuclei are counterstained with DAPI (blue). All images are at 63× magnification. Scale bar, 5 µm. (n) Number of nuclei analyzed. (D) Bar plots showing expression levels of FBXO32, TRIB3, and ZNF555 (FSHD1 lost-activated genes) in CN (gray) and FSHD1 (blue) MBs transfected with Ctrl BAC and BAC 4q-D4Z4n. Data were normalized on GAPDH expression. n = at least three (with the exception of TRIB3 and ZNF555 CN Ctrl BAC, n = 2). SEM is indicated. P-values were calculated by paired one-tailed t-test with a confidence interval of 99%. Dots represent the values of each replicate; asterisks represent statistical P-values: for FBXO32 Ctrl BAC versus BAC 4q-D4Z4n in CN, P = 0.0182; for FBXO32 Ctrl BAC versus BAC 4q-D4Z4n in FSHD1, P = 0.0073; for TRIB3 Ctrl BAC versus BAC 4q-D4Z4n in FSHD1, P = 0.0281. (E) Bar plot showing expression levels of LZTS3 (FSHD1 lost-repressed gene) in CN (gray) and FSHD1 (blue) MBs transfected with Ctrl BAC and BAC 4q-D4Z4n. Data were normalized on GAPDH expression. n = 3 (with the exception of CN Ctrl BAC, n = 2). SEM is indicated. P-value was calculated by paired one-tailed t-test with a confidence interval of 99%. Dots represent the values of each replicate; asterisks represent statistical P-values: for Ctrl BAC versus BAC 4q-D4Z4n in FSHD1, P = 0.0296. (F) Bar plots showing expression levels of FOXO3 and MYOG (not interacting genes) in CN (gray) and FSHD1 (blue) MBs transfected with Ctrl BAC and BAC 4q-D4Z4n. Data were normalized on GAPDH expression. n = at least three. SEM is indicated. Dots represent the values of each replicate.


