
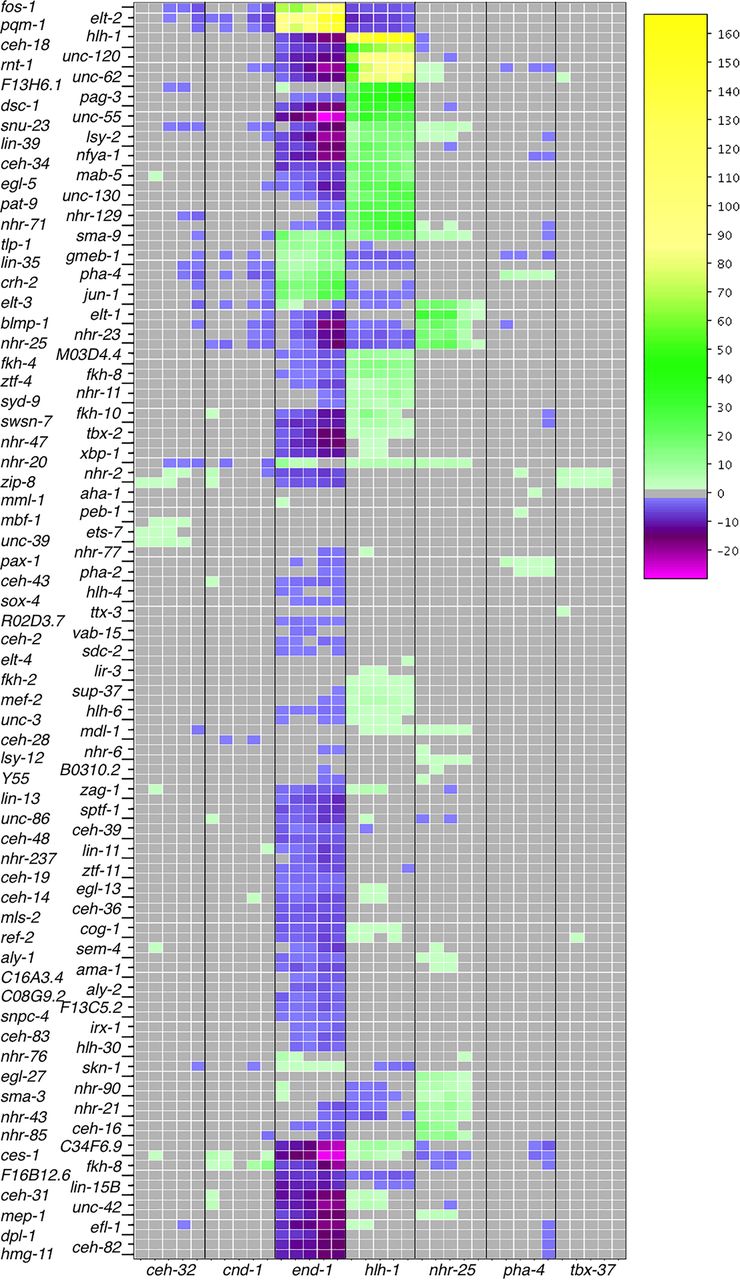
Regulation of DE genes by transcription factors. Transcription factors are both more highly associated with DE genes in tissues (yellow) or significantly less associated with DE genes in a tissue (magenta) than by a random sampling of ChIP-seq peaks. Tissue time points marked in gray indicate no significantly increased or decreased presence of transcription factor binding sites with a P-value cutoff of 0.01. This heatmap displays −log(P-values) for each transcription factor by tissue/time for transcription factors enriched in the set of DE genes. If a transcription factor is depleted in the set of DE genes, then log(P-value) is displayed, making the values less than zero. Any transcription factor that did not achieve significance in any tissue/time (P-values all >0.01), either enriched or depleted, was not placed into the heatmap. Y55A3AM.14 is abbreviated as “Y55.”


