
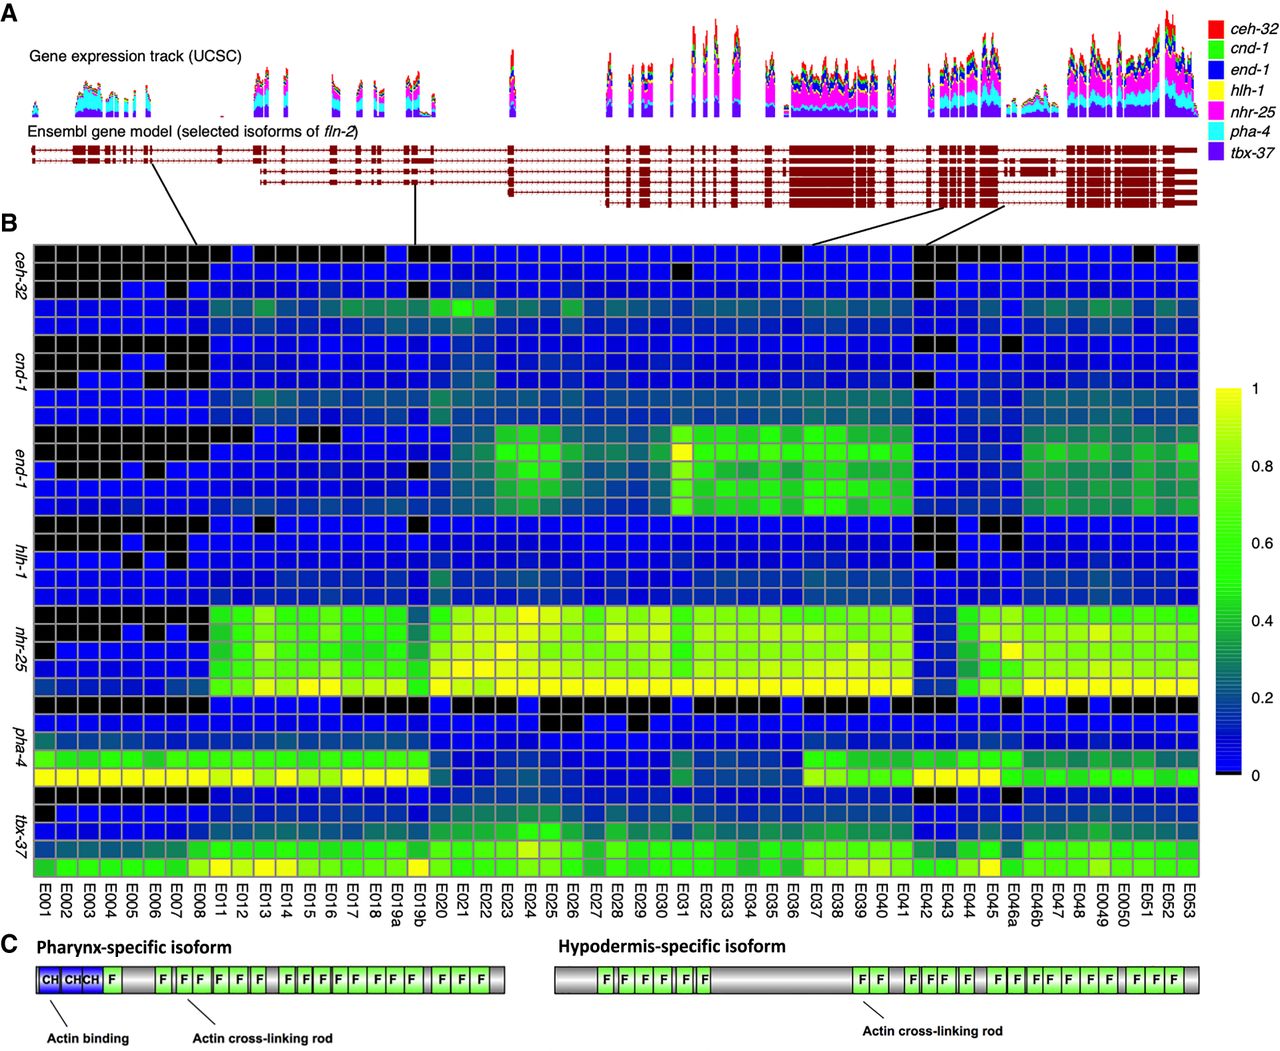
Differential exon usage for fln-2. Exon usage is highly differential between tissues for fln-2. (A) Selected isoforms of fln-2 with the UCSC gene expression track containing our data are displayed. Scale is zero to 2050 reads for time point 4 (normalized to 20 million total reads per sample). (B) In the heatmap displaying usage, tissues are organized by time from T0 to T4 along the y-axis within each tissue (as labeled), and exons are arranged by order on the x-axis. Expression values are normalized to a maximum of one for each exon and then colored by the percentage of expression compared with the maximum. Expression ranges from black (0) to yellow (1). (C) The resulting major protein products for the pharynx and hypodermis are shown, highlighting the major differences in number of filamin domains (label F) between the two products, as well as the total absence of calponin homology (label CH) domains in the hypodermal product.


