
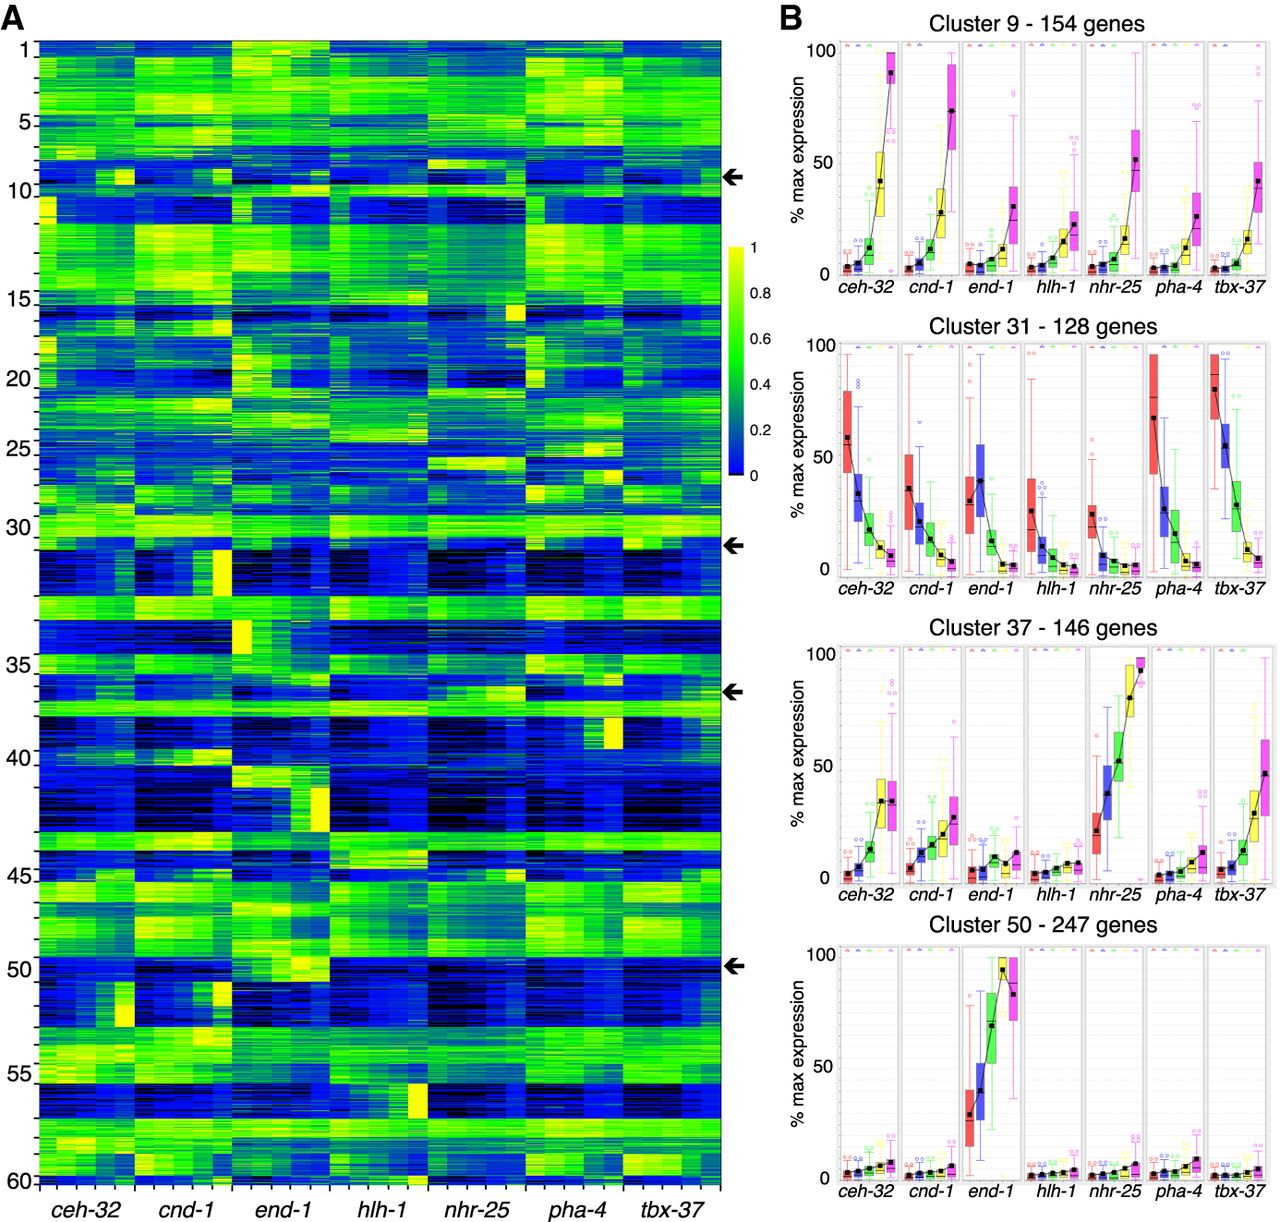
Gene expression across all tissues and stages. (A) By using the fuzzy k-means clustering displayed in Figure 2, expression was normalized to a maximum of one for the highest-expressed sample and then displayed as a heatmap. Each row is a gene, with the rows organized as clusters. Cluster numbers are given on the left. Within a cluster of gene expression, both temporal changes in gene expression and differential gene expression based on tissue are observed. (B) Examples of the different patterns of gene expression that occur within the clusters indicated by the arrows. There is broad, increasing zygotic expression in cluster 9, broad dropping expression in cluster 31, zygotic neuronal and hypodermal expression in cluster 37, and rapidly rising intestinal-specific expression in cluster 50.


