
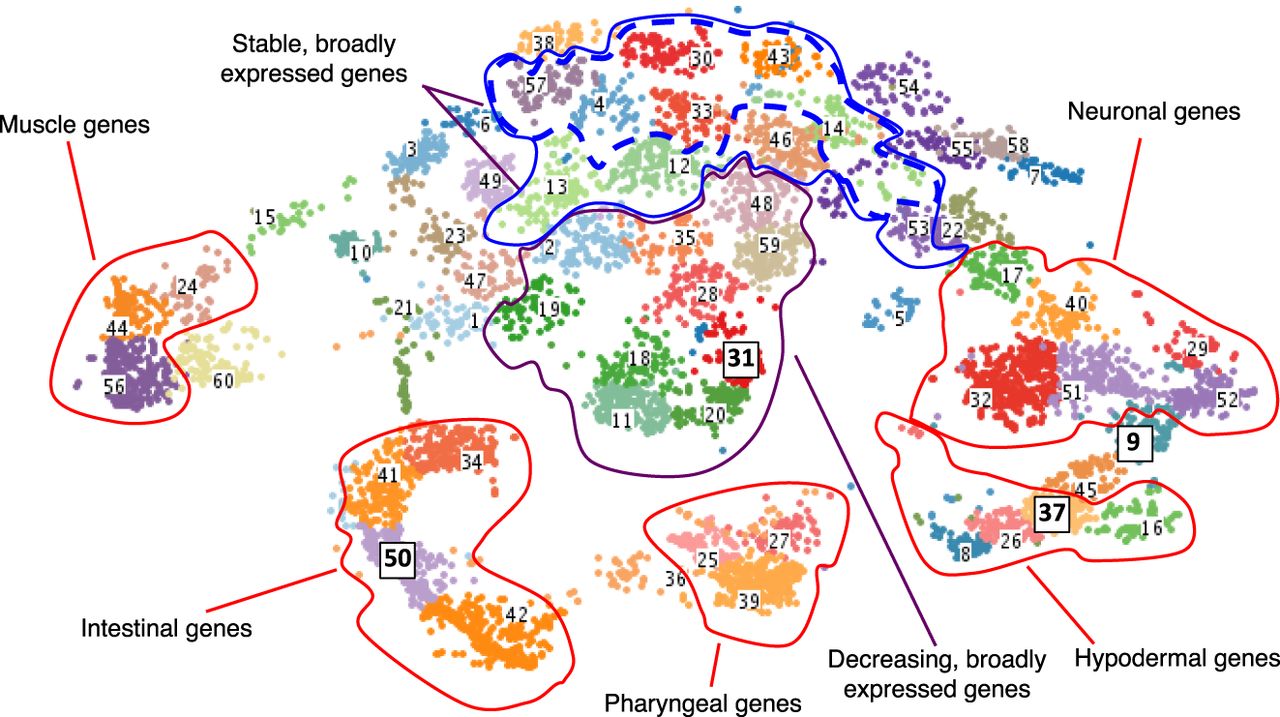
Clustered gene expression visualized with t-SNE. Gene expression values (TPM) were clustered using fuzzy k-means clustering and then visualized in t-SNE space to group genes with similar expression patterns. Genes that have enriched expression based on tissue are clustered outward from nonenriched genes in the plot and separated based on their specific tissue enrichment (outlined in red). Within nontissue enriched genes, the separation of genes into clusters is often temporal in nature, with stably expressed genes appearing in clusters toward the top of the plot (blue outline) and broadly expressed genes that are dropping in expression value located in the very center of the plot (purple outline). Clusters with the highest proportion of stable and broadly expressed genes are outlined in a dashed blue line. Clusters discussed in more detail in the text and in Figure 3 are highlighted with boxes around the label and larger font size.


