
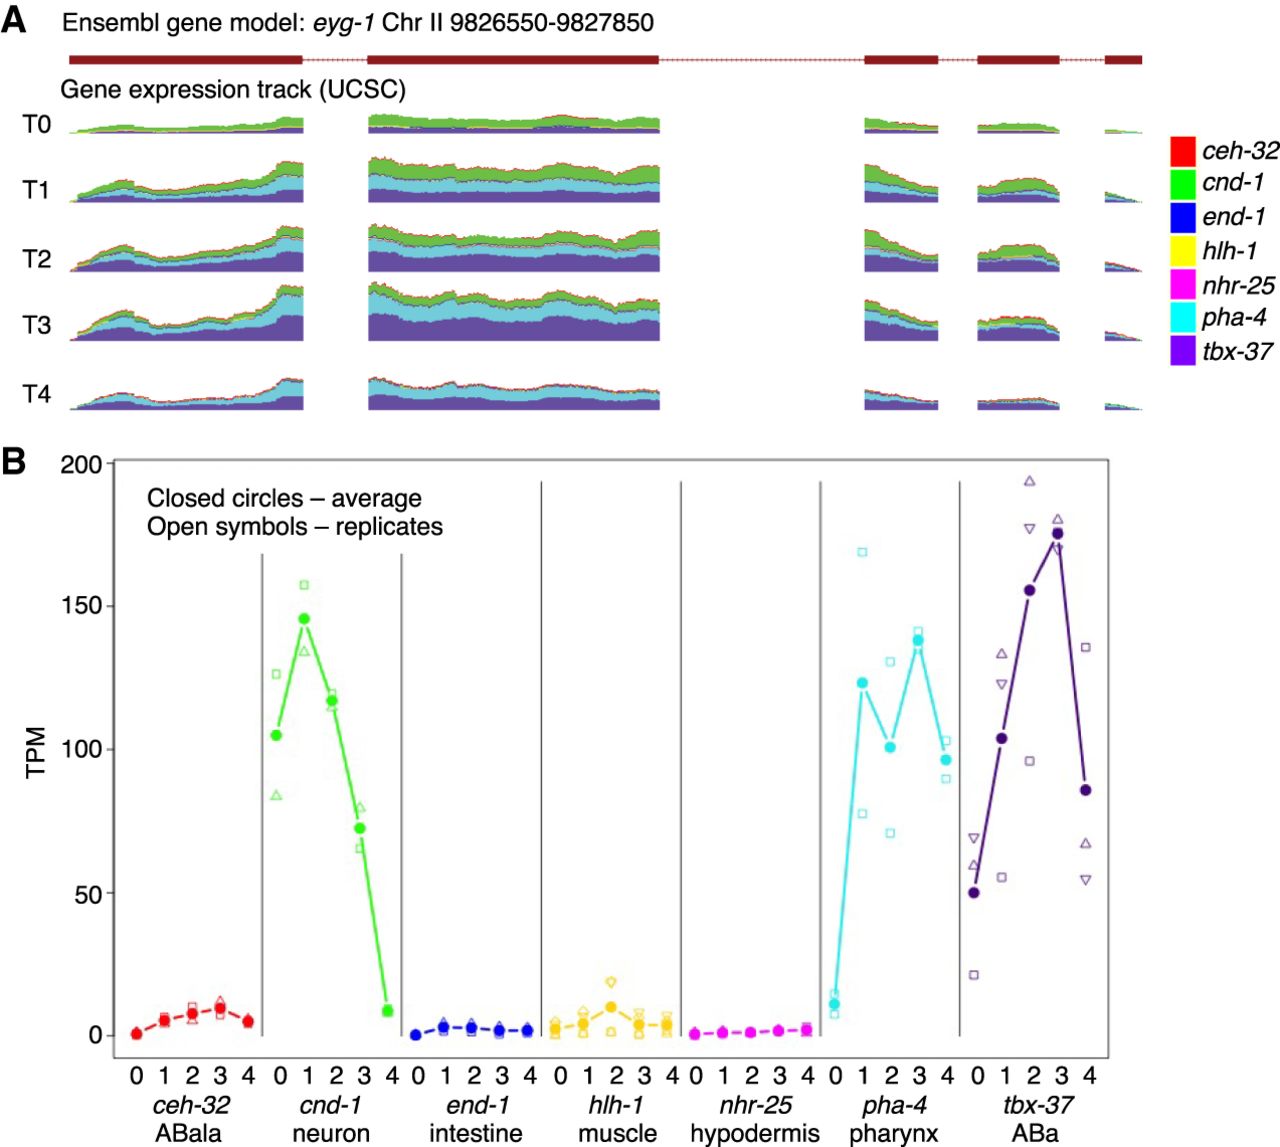
Figure 1.
Gene expression changes spatially over time. In gene eyg-1, expression transitions from being expressed primarily in neurons at time point 0 to being expressed almost completely in pharyngeal cells by time point 4 (A). Significant expression occurs through all time points in ABa lineage, which encompasses a subset of both neuronal and pharyngeal cell types. (B) Average expression values for eyg-1 are labeled as closed circles and are connected; individual data points are shown as open symbols. Legend indicates colors for each tissue. Scale is zero to 850 reads for each time point (normalized to 20 million total reads per sample; A).


