
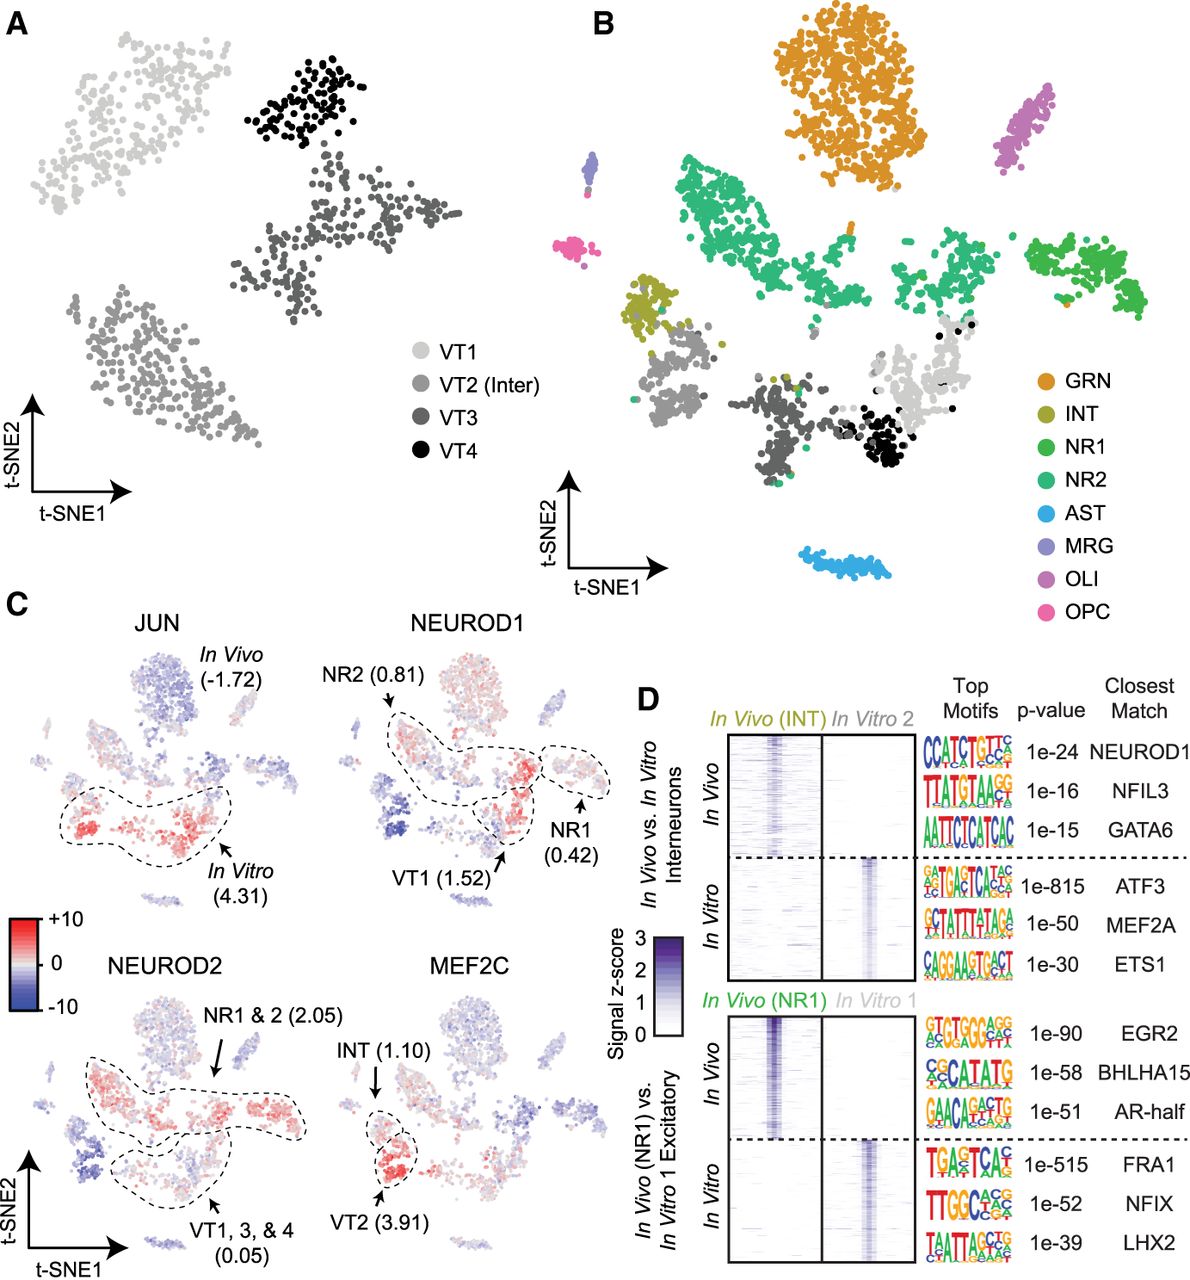
Comparison of the accessible chromatin landscape of in vitro-cultured neurons with in vivo-obtained profiles. (A) LSI-t-SNE projections of in vitro-obtained cells reveals four clusters, one of which exhibits interneuron patterns (VT2) and the remaining excitatory neurons (VT1, VT3-4). (B) LSI-t-SNE projection of the combined in vivo and in vitro data sets colored by independently called clusters. Excitatory neurons in the two conditions generally cluster separately, with interneurons more closely associated. (C) chromVAR global motif deviation Z-scores for select motifs for each cell. Dashed lines and values correspond to mean values of cell populations. (D) Differential accessibility analysis between in vivo and in vitro interneurons (top; INT vs. VT2, respectively) and between two closest excitatory neuron populations between in vivo and in vitro conditions (NR1 and VT1, respectively). ATAC-seq signal is shown for the top differentially accessible loci with the top three motifs and corresponding P-values and matching motifs to the right.


